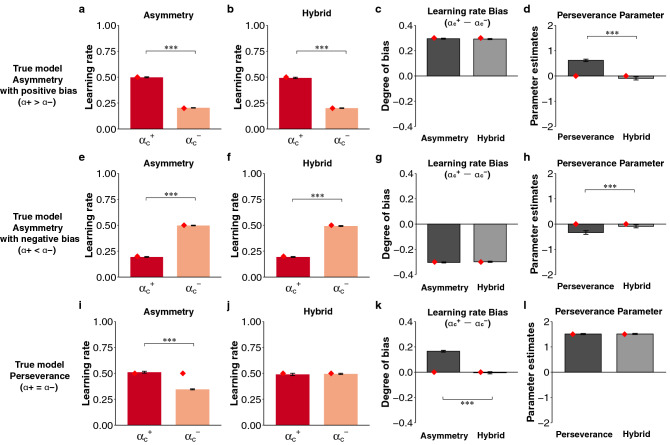
Figure 2.
The results of the simulation in the factual learning context. (a–d) The results of the true model with asymmetric learning rates assuming positivity bias (). (e–h) The results of the true model with asymmetric learning rates assuming negativity bias (). (i–l) The results of the true model assuming symmetric learning rates () and choice perseverance (φ = 1.5). (a,e,i) The first column indicates the learning rates in the Asymmetry model. (b,f,j) The second column indicates the learning rates (, ) in the Hybrid (gradual) model. (c,g,k) The third column shows the degree of learning rate bias (). (d,h,l) The final column shows the perseverance parameter (φ) in the Perseverance (gradual) and Hybrid (gradual) models. ***p < 0.001, **p < 0.01 and *p < 0.05. The error bars represent the standard error of the mean. The diamonds denote the ground-truth value of the parameters used in the data generation.

