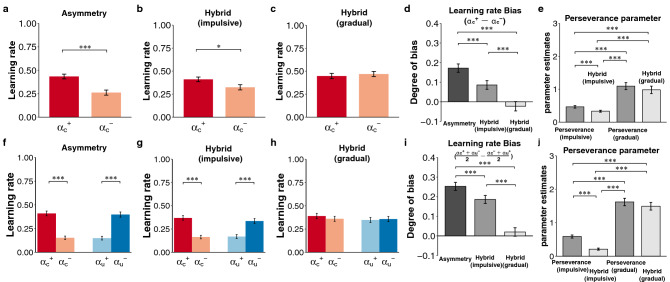
Figure 4.
The results of the web-based experiment. The rows show the results of the web-based experiment in the factual and counterfactual learning contexts. The first to third columns represent the learning rates in the Asymmetry (a,f), Hybrid (impulsive) (b,g), and Hybrid (gradual) models (c,h). (d,i) The fourth column indicates the degree of learning rate bias (i.e., positivity bias in the factual context and confirmation bias in the counterfactual context). (e,j) The final column shows the perseverance parameter (φ) in the Perseverance (impulsive), Perseverance (gradual), Hybrid (impulsive), and Hybrid (gradual) models. ***p < 0.001, **p < .01 and *p < 0.05. The error bars represent the standard error of the mean.

