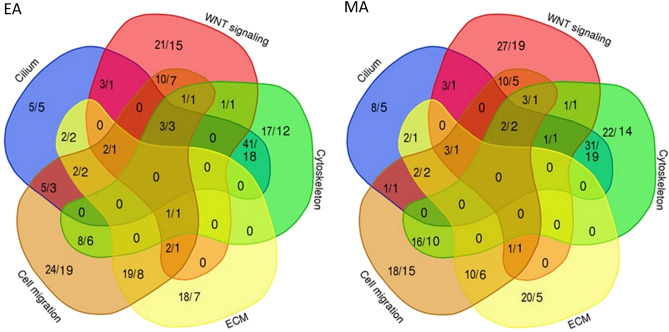
Figure 5.
URDV containing candidate genes involved in multiple ontology groups. The Venn diagrams showed the relation and distribution of UTDV count and NTD candidate genes count to five ontology groups for EA (a) and MA (b). The number of URDVs and number of genes classified to cilium, WNT signaling, cytoskeleton, extracellular matrix (ECM) and cell migration are shown as fraction (count of URDV/count of gene). Genes classified to multiple categories were shown in the overlapped subset compartments between categories. Details on genes within each segment can be found in Supplementary Table 5.

