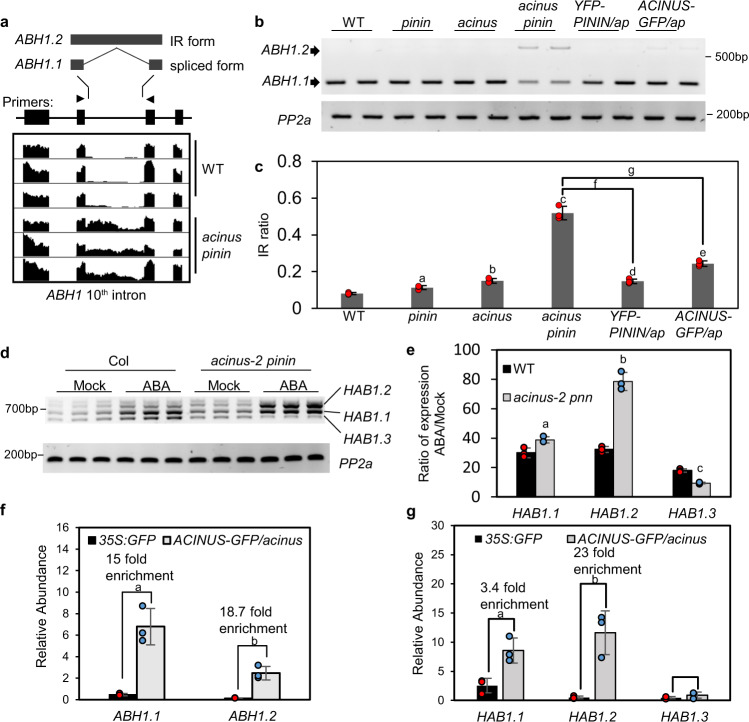
Fig. 4. ABH1 and HAB1 showed increased intron retention in acinus-2 pinin-1 and ABH1 and HAB1 mRNAs are associated with AtACINUS.
a Integrative genomic viewer (IGV) display of increased intron retention (IR) of the ABH1 10th intron in acinus-2 pinin-1 compared to WT. b RT-PCR of ABH1 in 12-day-old seedlings of the indicated genotypes using primers at positions indicated by arrowheads in a. c Intron retention ratio of ABH1 10th intron as determined by RT-qPCR in 12-day-old seedlings of the indicated genotypes. The intron-containing form ABH1.2 was highly accumulated while the spliced form ABH1.1 was reduced in acinus-2 pinin-1 compared to WT, the single mutants, or the double mutant complemented by YFP-AtPININ or AtACINUS-GFP. Statistically significant differences to WT or between indicated genotypes were determined by two-tailed t test. The P values for a, b, c, d, e, f, and g are 1.97E−2, 5.02E−3, 1.94E−3, 4.90E−4, 9.01E−4, 1.39E−3, and 2.32E−3. d RT-PCR of HAB1 in 12-day-old WT and acinus-2 pinin-1 seedlings treated with ABA (100 μmol/L for 3 h). e RT-qPCR quantification of the fold changes of expression levels of each splice forms of HAB1 after ABA treatment of 12-day-old WT and acinus-2 pinin-1 seedlings. The P values for a, b, and c are 2.29E−2, 3.08E−3, and 1.60E−3. f, g Quantification of ABH1 and HAB1 mRNAs by qPCR after RNA-IP using α-GFP antibody in 7-day-old AtACINUS-GFP/acinus-2 seedlings, compared to 35S::GFP as a negative control. Statistical significance was determined by two-tailed t test. The P values for a and b in f are 2.24E−2 and 2.31E−2. The P values for a and b in g are 2.18E−2 and 3.54E−2. Values represent mean ± SD calculated from three biological replicates (n = 3) for c, e, f.

