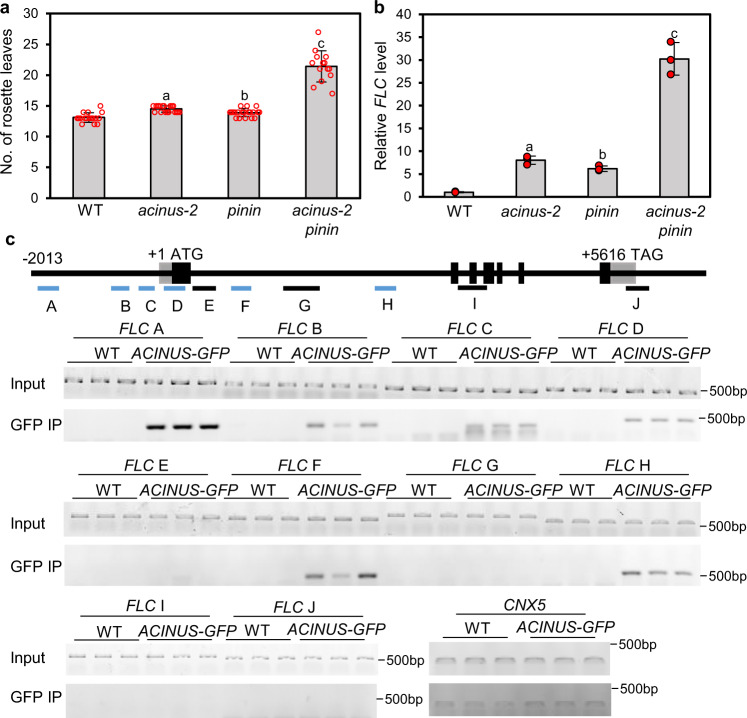
Fig. 5. The acinus-2 pinin-1 double mutant is late flowering with increased FLC expression.
a Rosette leaf numbers of WT, acinus-2, pinin-1, and acinus-2 pinin-1 at bolting stage grown in long day condition. Error bars indicate SD calculated from n > 12. Values represent mean ± SD calculated from at least 12 plants (n > 12). Statistically significant differences to WT were determined by two-tailed t test. The P values for a, b, and c are 1.35E−6, 2.48E−3, and 5.15E−9. b FLC expression level relative to UBQ (At5g15400) in WT, acinus-2, pinin-1, and acinus-2 pinin-1, determined by RT-qPCR in 12-day-old seedlings. Values represent mean ± SD calculated from three biological replicates (n = 3). Statistically significant differences to WT were determined by two-tailed t test. The P values for a, b, and c are 5.15E−3, 3.32E−3, and 4.91E−3. c Analysis of AtACINUS-GFP association with the FLC locus by ChIP-PCR in 12-day-old AtACINUS-GFP/acinus-2 seedlings. WT serves as the negative control. Bars below the gene structure diagram represent regions analyzed by PCR (blue bars indicate regions enriched after immunoprecipitation). GFP IP shows PCR products using immunoprecipitated DNA. CO-FACTOR FOR NITRATE, REDUCTASE, AND XANTHINE DEHYDROGENASE 5 (CNX5) serves as an internal control to show non-specific background DNA after immunoprecipitation. PCR reactions were set to 28 cycles.

