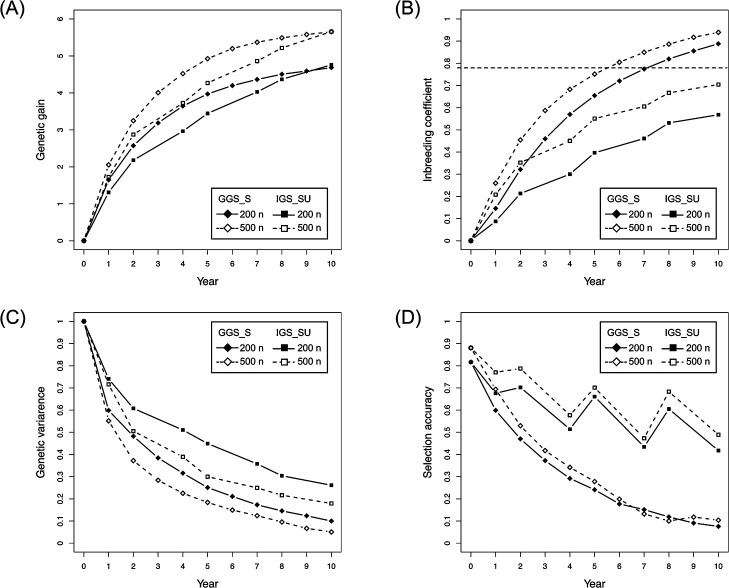
Fig. 5.
Impact of population size. Comparison of each property between GGS_S and IGS_SU with different population sizes, with the setting of 100 QTLs, 500 markers, and h2 = 0.3. The panels indicate the mean of the genetic value (A), inbreeding coefficient (B), genetic variance (C), and selection accuracy (D). Horizontal dashed lines in (B) indicate the threshold value of inbreeding depression.

