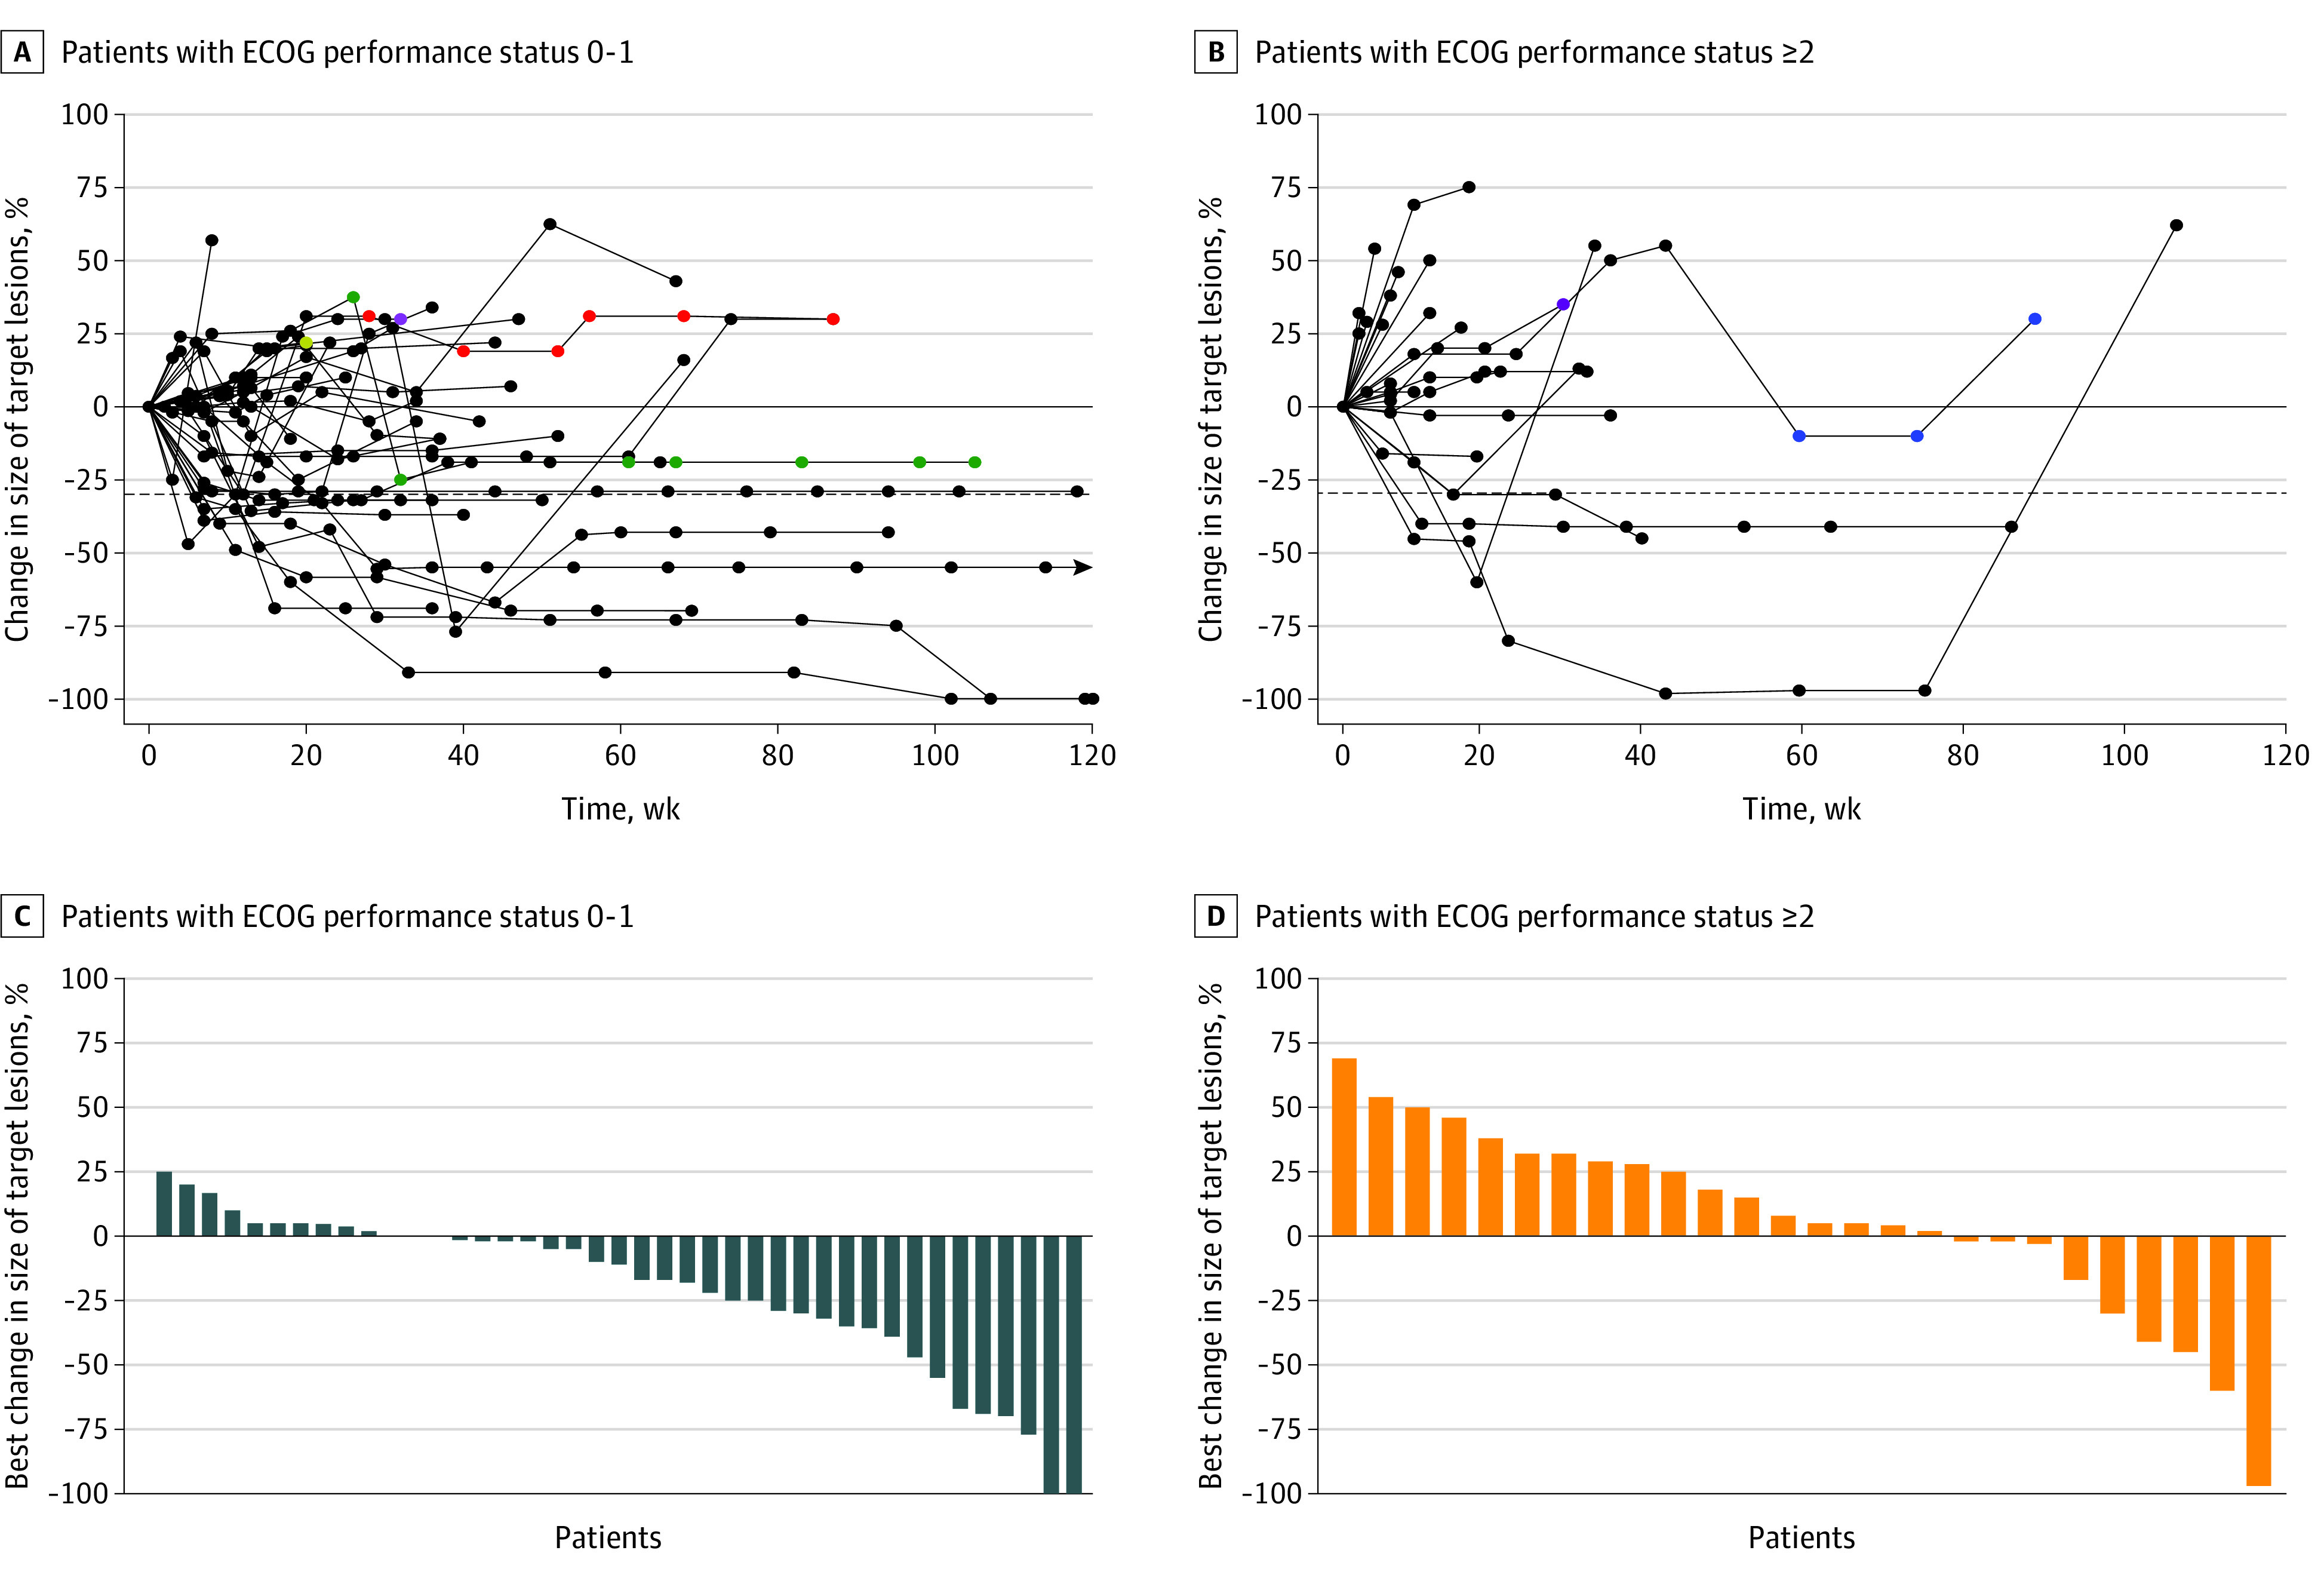
Figure 1. Treatment Response by Performance Status.

A, B, Black dots represent treatment before confirmed progression of disease. Other dots represent treatment beyond progression, with individual patients represented by unique colors. Arrows represent ongoing treatment. ECOG indicates Eastern Cooperative Oncology Group.
