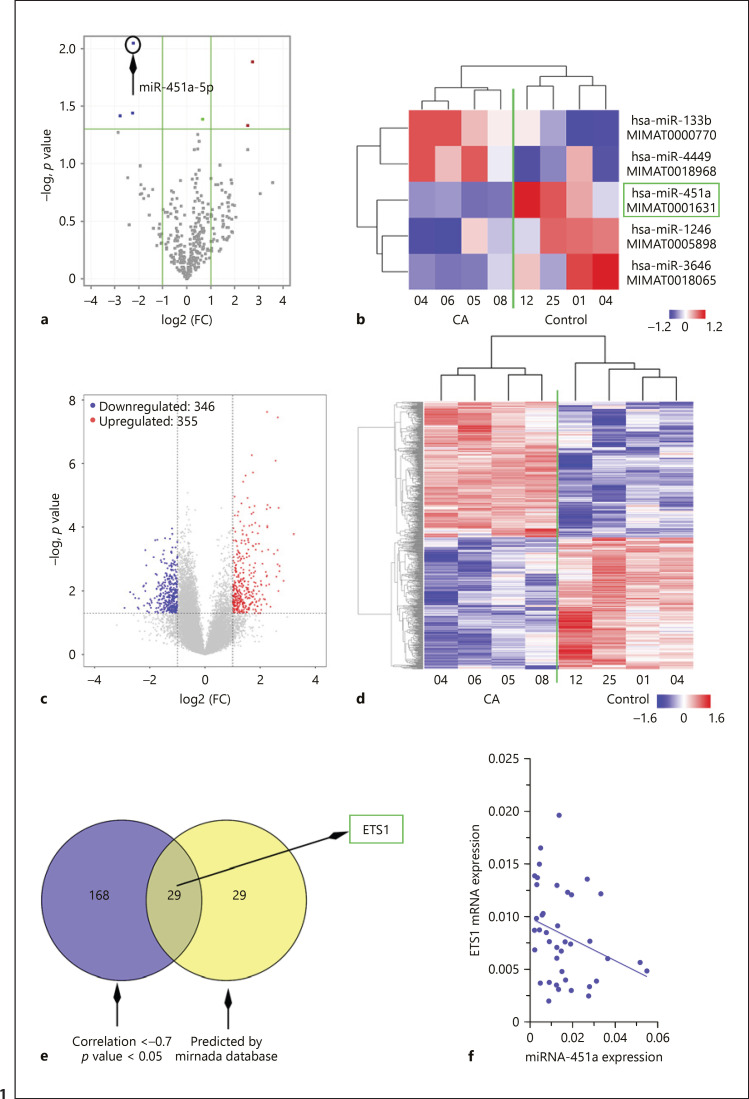
Fig. 1.
Downregulation of miRNA-451a and upregulation of ETS1 observed in lymphocytes derived from children with asthma (CA). a, c Volcano blots showed downregulated miRNAs as blue dots, and upregulated miRNAs as red dots. b, d All differentially expressed miRNAs and mRNAs are shown in heatmaps. Each row represents an miRNA or an mRNA, and each column indicates a sample. e The predictive targets of miR-451a with expression levels negatively correlated with miR-451a based on microarray data are shown in the Venn diagram. f The expression correlation between miR-451a and ETS1 CD4+ T cell samples from 10 control and 30 asthmatic children was analyzed with the Spearman correlation test (p < 0.05).

