
Figure 3:
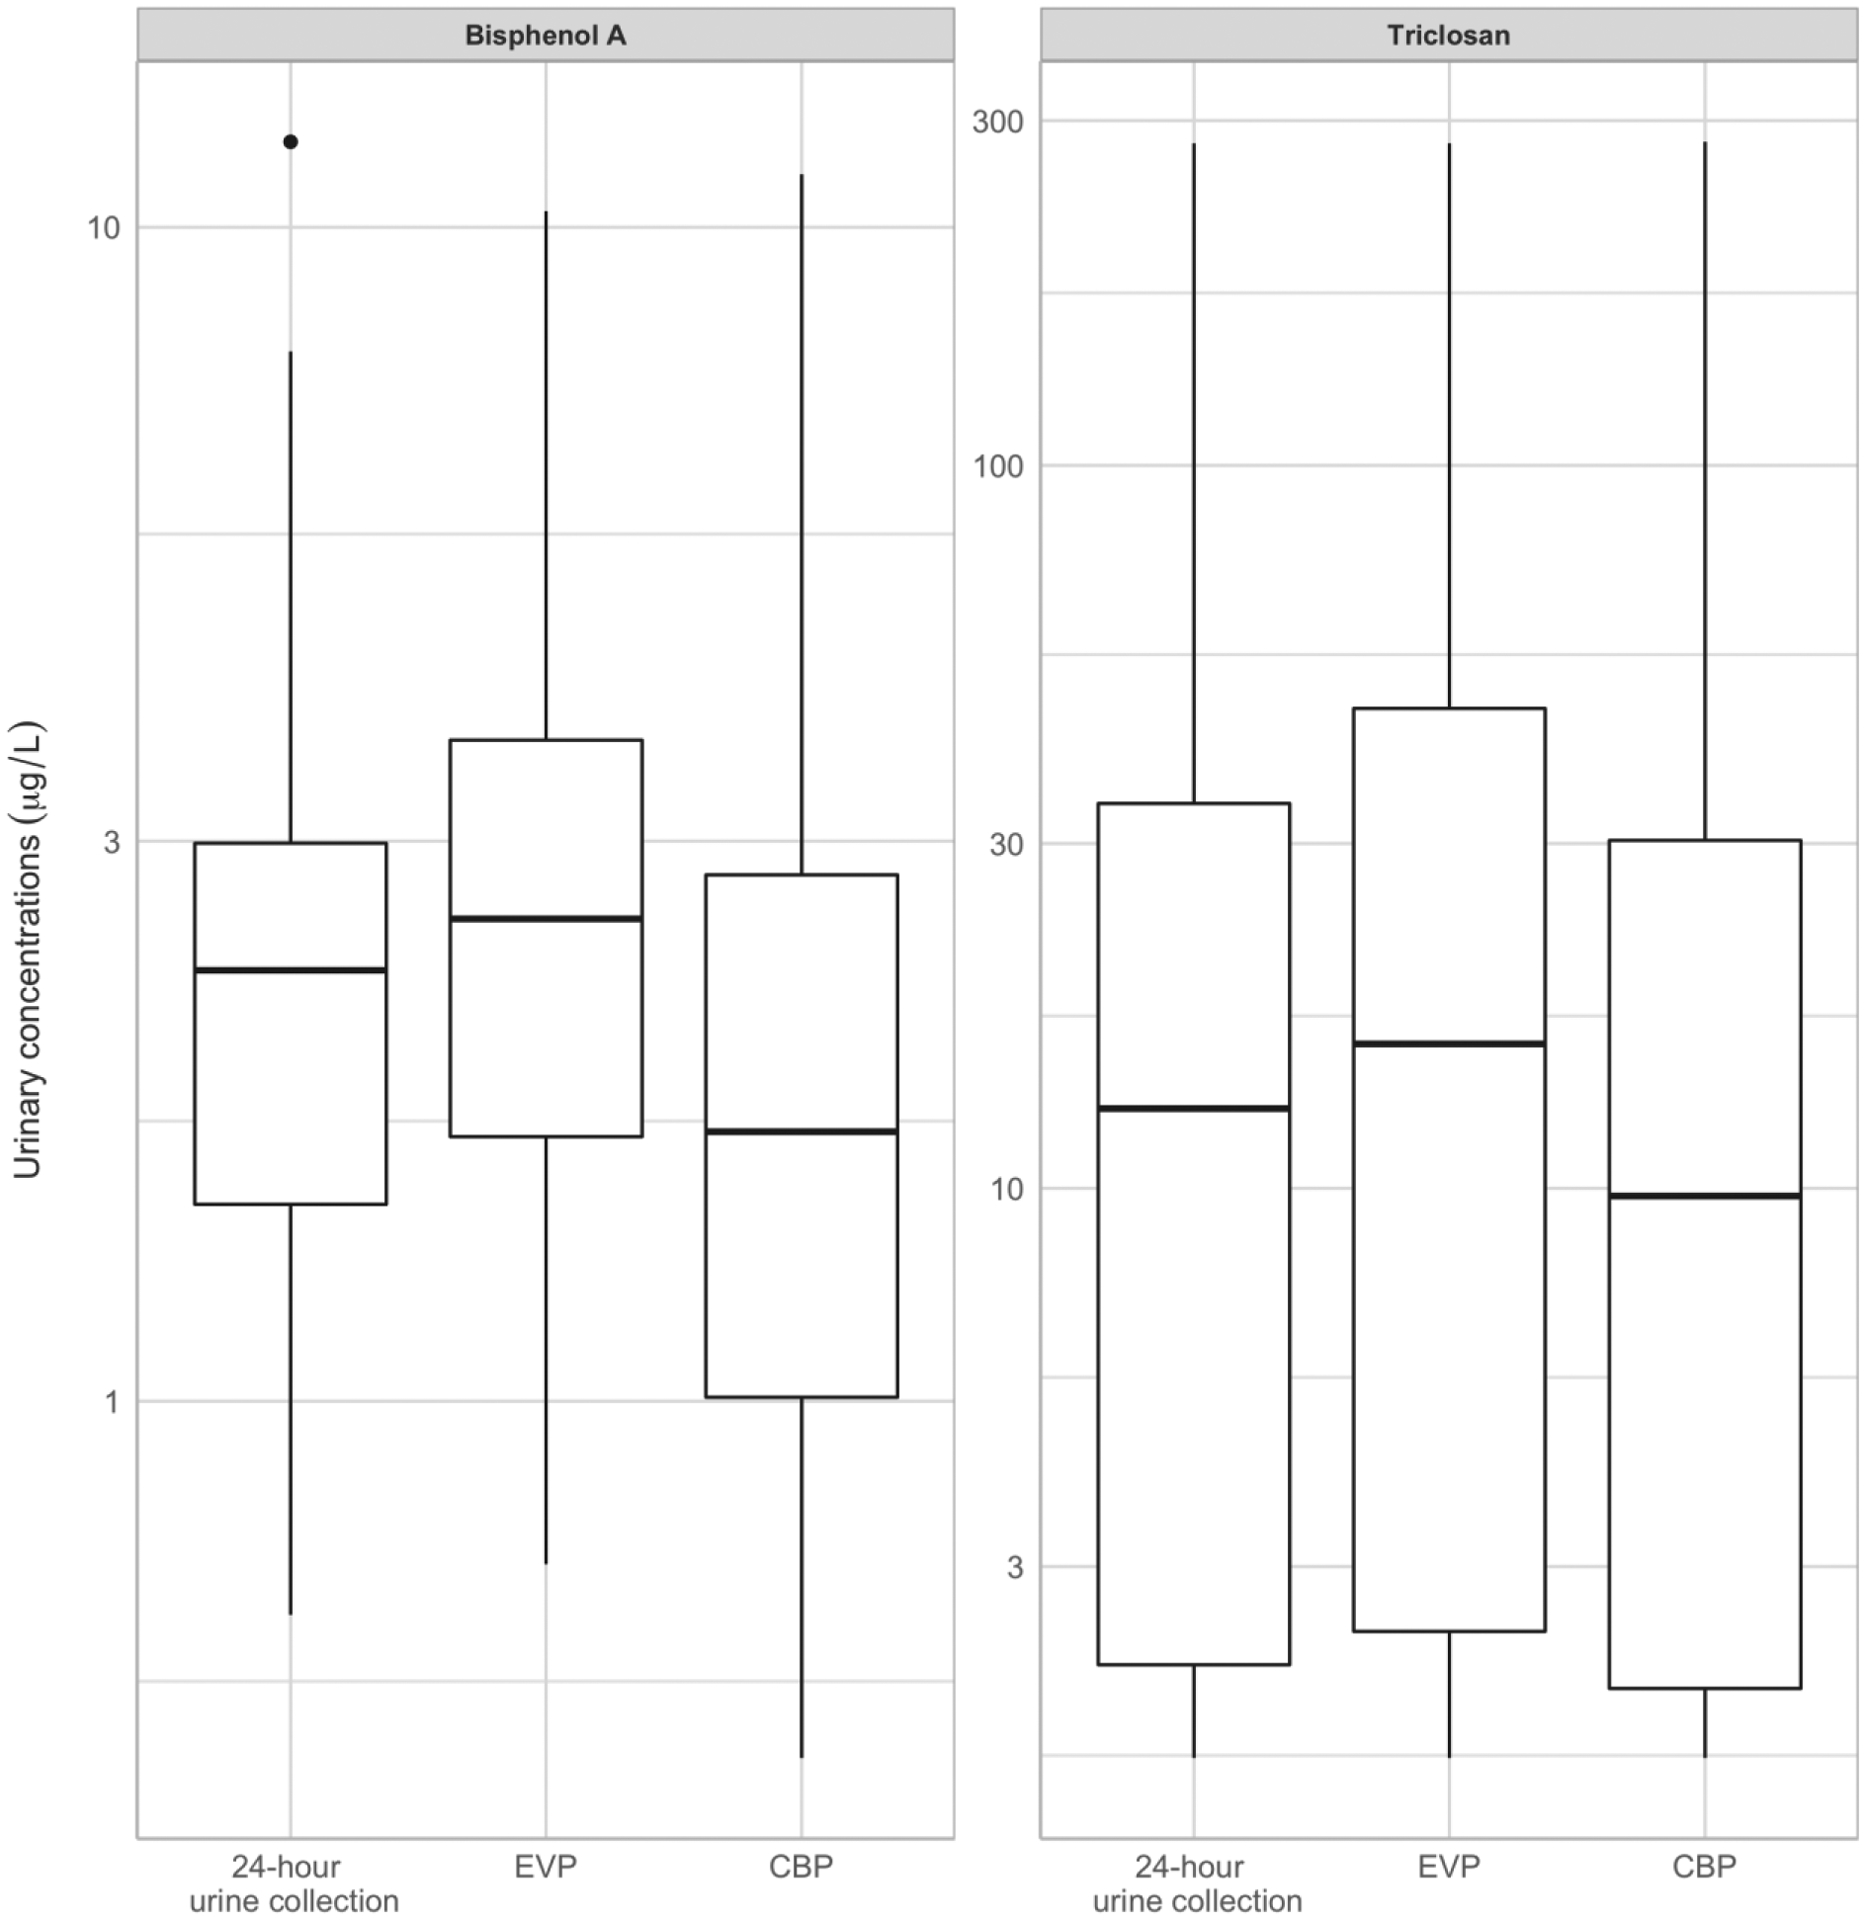
Distribution of BPA and triclosan concentrations estimated in 24-h urine collection (gold standard), equal-volume (EVP) and creatinine-based (CBP) pools among the eight study participants
Boxes lines represent 75th (upper line), 50th (middle line) and 25th (lower line) percentiles.