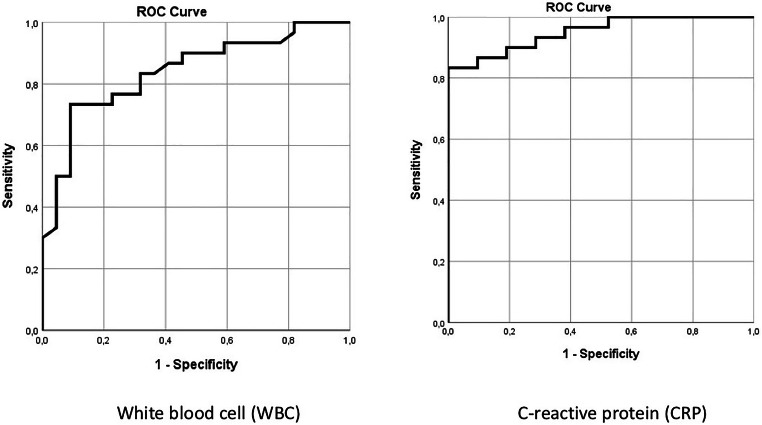
Fig. 3.
The ROC curve of WBC and CRP levels on admission for MIS-C cases. WBC, white blood cell and CRP, C-reactive protein. The ROC curve of CRP was determined significant (p<0.001), and area under curve (AUC) of the ROC curve was 0.951 (95%CI: 0.85–0.99), and the AUC of the ROC curve was 0.840 for WBC (95%CI: 0.71–0.92) (p<0.001)

