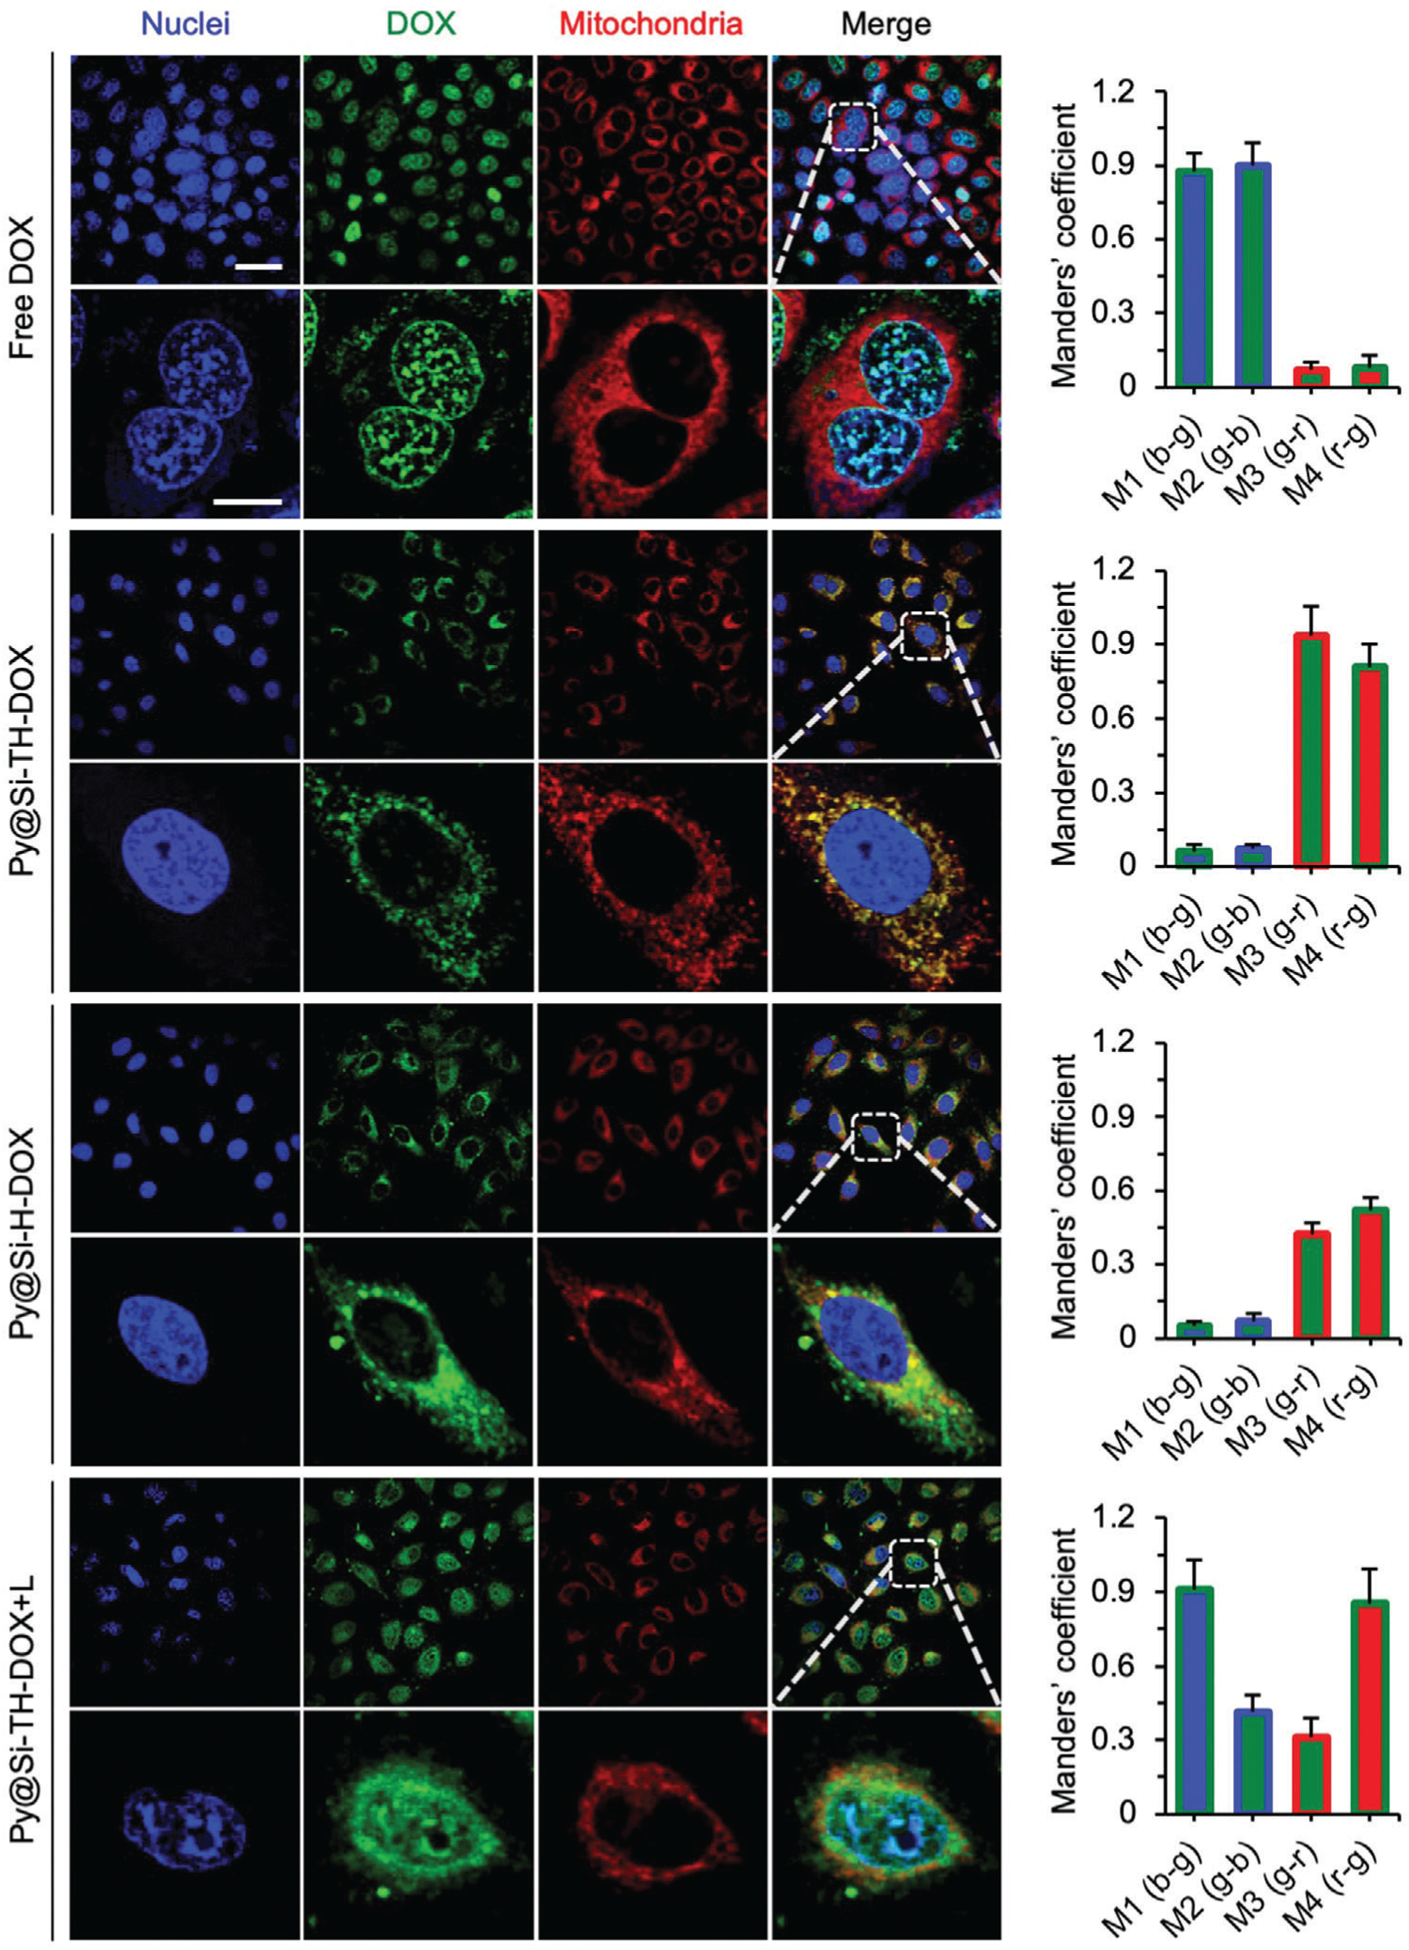
Figure 3.

Cell uptake of nanoparticles and their subcellular distribution. Confocal images showing cell uptake and subcellular distribution of Py@Si-TH-DOX nanoparticles compared with free DOX and Py@Si-H-DOX nanoparticles (no mitochondria targeting capability) in MDA-MB-231 cells. Cells were incubated with MitoTracker Deep Red (red) and DAPI (blue) to stain their mitochondria and nuclei, respectively. The merged and zoom-in images show effective overlap of mitochondria (red) and the Py@Si-TH-DOX nanoparticles (green), demonstrating the mitochondria-targeting capability of the nanoparticles. Such overlap is minimal for the Py@Si-H-DOX nanoparticles. Furthermore, the overlap between cell nuclei (blue) and DOX (green) is evident after NIR laser irradiation of the cells treated with Py@Si-TH-DOX nanoparticles (i.e., Py@Si-TH-DOX+L), because of the high binding affinity between DOX and the nuclear materials. This indicates the NIR laser-triggered release of DOX from the nanoparticles inside cells. These qualitative observations are confirmed by quantitative analyses of the colocalization of DOX with nuclei and mitochondria using Manders’ coefficients: M1 (b–g) denotes the fraction of nuclei/blue overlapping with DOX/green, M2 (g–b) denotes the fraction of DOX/green overlapping with nuclei/blue, M3 (g–r) denotes the fraction of DOX/green overlapping with mitochondria/red, and M4 (r–g) denotes the fraction of mitochondria/red overlapping with DOX/green. Scale bars: 20 μm and 5 μm for low and high magnification images, respectively.
