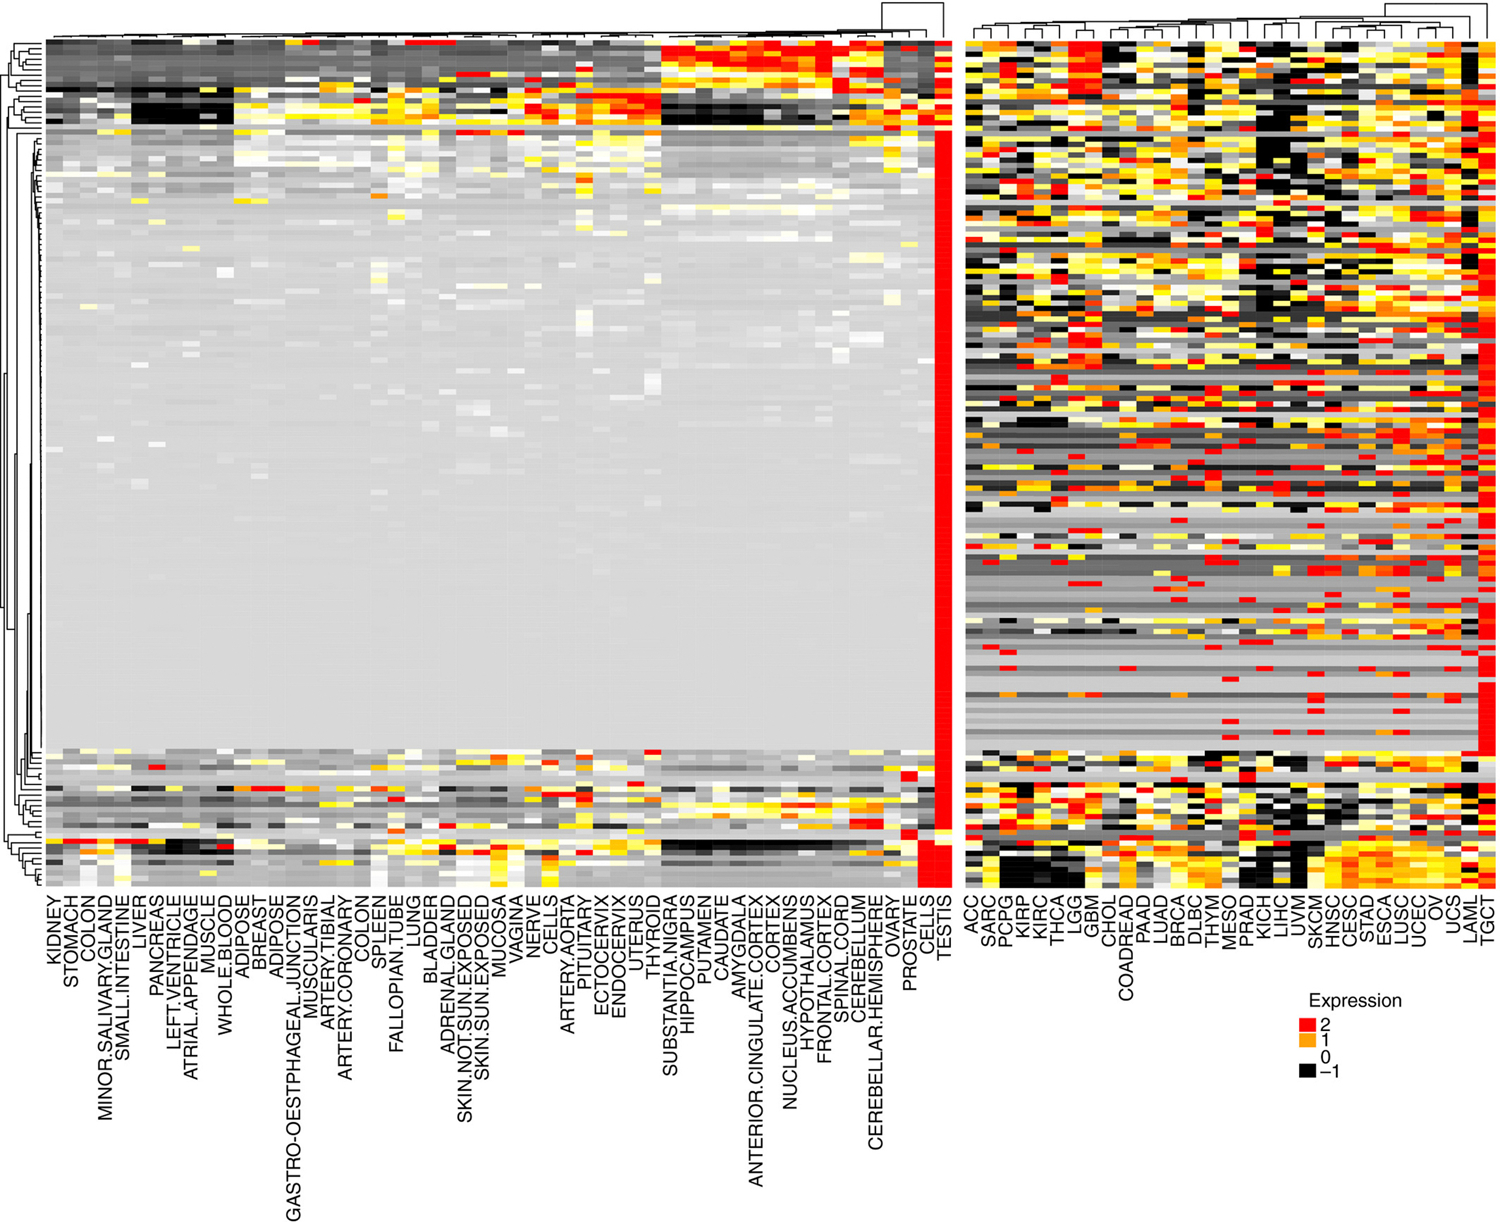
Figure 1.

Expression pattern of 162 CT genes across normal tissues from GTeX and patient tumor samples from TCGA. RNASeq data were obtained from GTeX (normal tissues) or TCGA PANCancer study (tumors). The median expression per each CT gene was calculated across all patients in a specific tissue. Each cell in the heatmap indicates the median expression of a CT gene in the tissue indicated at the bottom of the figure. Red cells indicate high expression and black cells low expression levels.
From Want MY, Lugade AA, Battaglia S, et al. Nature of tumour rejection antigens in ovarian cancer. Immunology 2018; with permission.
