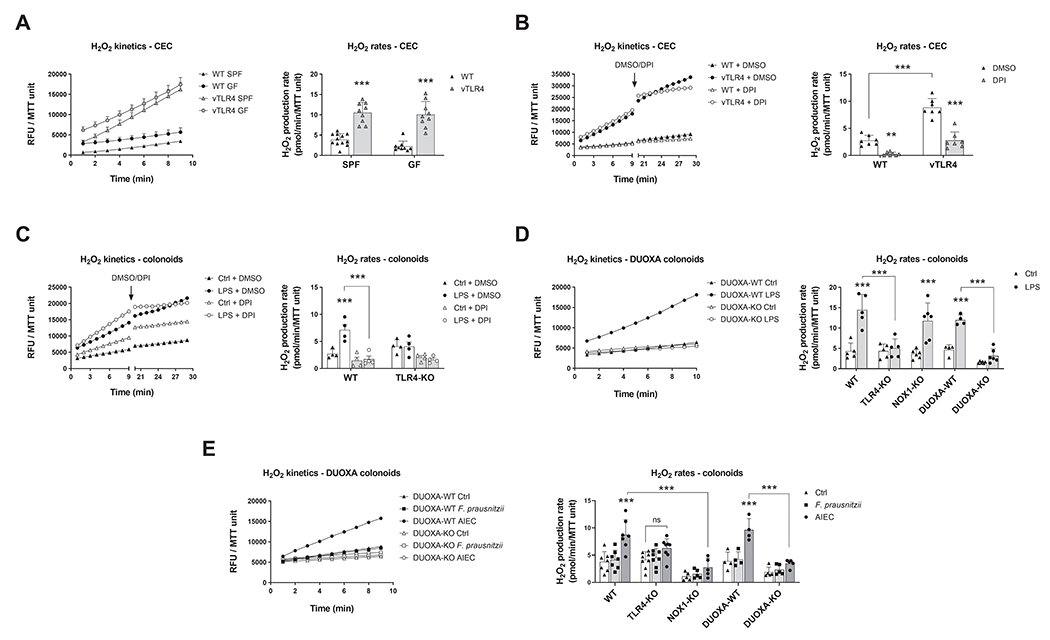
Figure 3 |. Activation of TLR4 induces epithelial production of H2O2 via DUOX2.

Left panels show kinetic production of H2O2 in one representative experiment expressed in relative fluorescence units (RFU) normalized to MTT viability values. Right panels show the H2O2 production rate in all experiments. (A) Freshly isolated CECs were assayed for the kinetic production of H2O2 in SPF and GF-raised villin-TLR4 mice and littermates. Villin-TLR4 mice had increased H2O2 production rates (***P<0.001) when compared to WT littermates (n=9-12 mice). (B) We tested the effects of NADPH oxidase inhibition in freshly isolated CECs by adding DPI or DMSO after 9 minutes of kinetic determination and measuring for 10 additional minutes. DPI markedly reduced H2O2 production in WT (**P<0.01) and villin-TLR4 (***P<0.001) CECs (n=7 mice). (C) Production of H2O2 was determined in WT and TLR4-KO colonoids stimulated for 24 hours with LPS. Left panel shows H2O2 production kinetics in WT organoids. LPS stimulation induced a release of H2O2 in WT colonoids (***P<0.001) that was completely abrogated by DPI (***P<0.001; n=4 cultures). (D) and (E) TLR4-KO, DUOXA-KO, and NOX1-KO colonoids were stimulated with LPS (n=4-6 cultures), F. prausnitzii, or AIEC (n=4-9 cultures) and their release of H2O2 was determined (***P<0.001). Data in all figures were analyzed by two-way ANOVA followed by Sidak’s post-hoc test.
