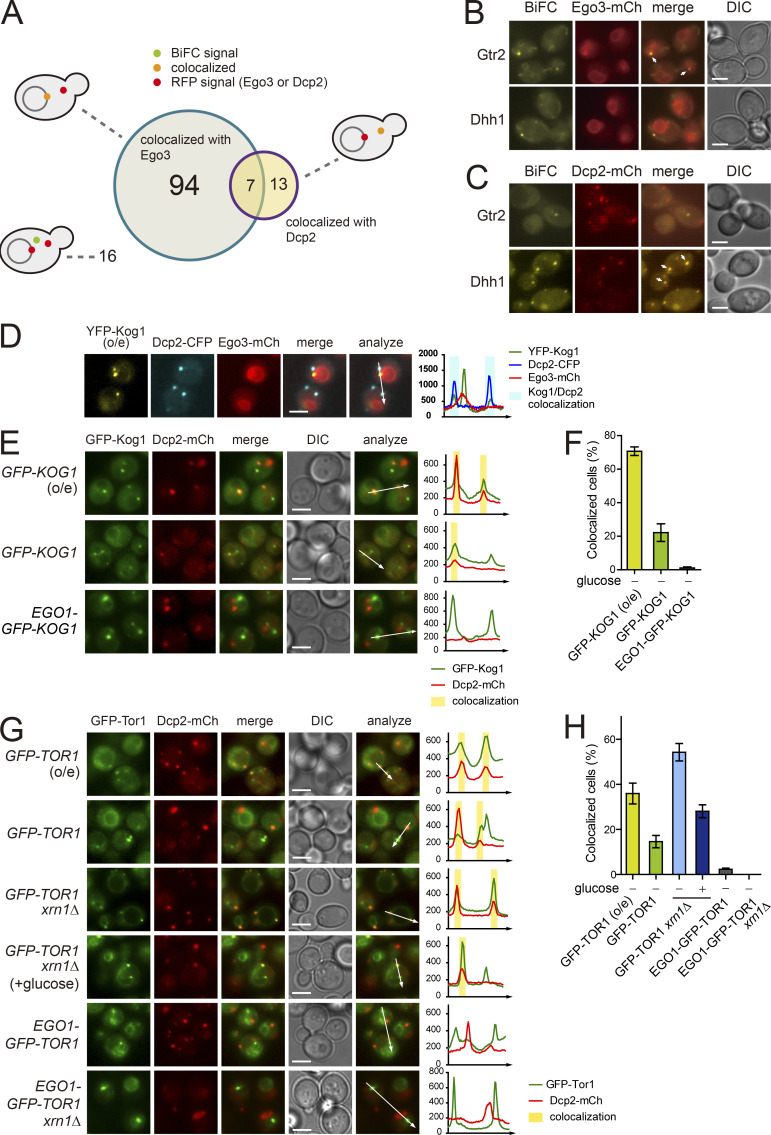
Figure 2.
A portion of TORC1 localizes to P-bodies. (A) Venn diagram showing the numbers of the BiFC signals for Kog1 interactors that were colocalized with Ego3 or Dcp2. (B) Examples of the BiFC signals that were colocalized (Gtr2) or not colocalized (Dhh1) with Ego3. Arrows indicate colocalized signals. (C) Examples of the BiFC signals that were colocalized (Dhh1) or not colocalized (Gtr2) with Dcp2. Cells were starved of glucose for 30 min. Arrows indicate colocalized signals. (D) Three-color colocalization analysis of TORC1 (YFP-Kog1), P-bodies (Dcp2-CFP), and the vacuolar membrane (Ego3-mCherry). Fluorescent signals were visualized after 30 min of glucose starvation. (E) Colocalization between Kog1 and P-bodies. Cells expressing GFP-Kog1 under the HXK2 or CET1 promoter and Ego1-GFP-Kog1 under the CET1 promoter were starved of glucose for 30 min to induce P-body formation. (F) Quantification of the ratio of cells showing the colocalization of Kog1 with P-bodies. (G) Colocalization between Tor1 and P-bodies. Cells were starved of glucose for 30 min to induce P-body formation, except “GFP-TOR1 xrn1Δ (+glucose)” cells, which were observed under normal growth conditions. (H) Quantification of the ratio of cells showing the colocalization of Tor1 with P-bodies. Error bars represent SD, and values represent the average of three independent experiments (n > 200) in F and H. Scale bars, 2 µm for B–E and G. Fluorescence intensity profiles along the arrows were obtained using ImageJ software and shown on the right in D, E, and G. o/e indicates overexpression under the HXK2 promoter.

