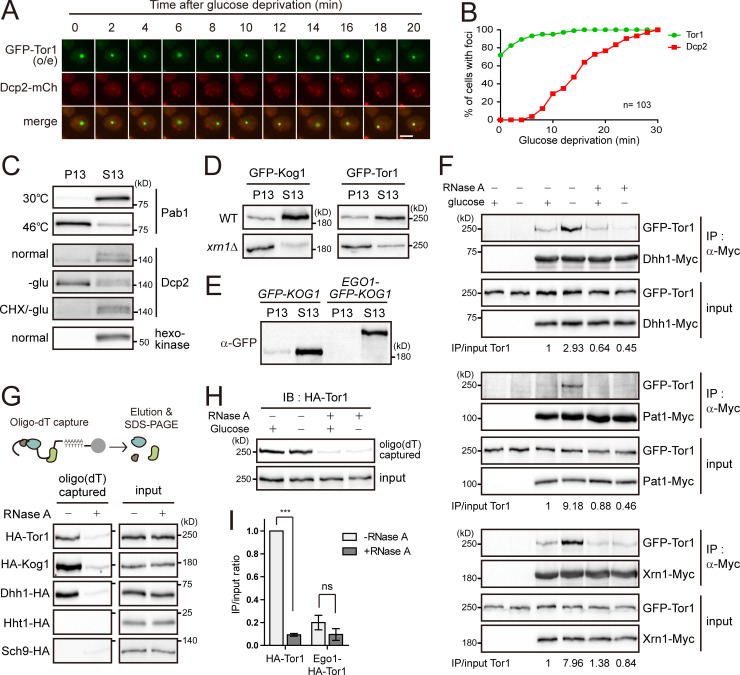
Figure 3.
TORC1 has interaction with mRNAs. (A) Time-course analysis of Tor1 foci and P-body formation. Images of cells were taken every 2 min after glucose deprivation. Scale bar, 2 µm. (B) Kinetics of Tor1 foci and P-body formation under glucose starvation. Images of Tor1 foci and P-bodies were taken every 2 min after glucose deprivation. Among 245 cells examined, 103 cells exhibited the colocalization of Tor1 foci and Dcp2 at 30 min of glucose starvation. For these 103 cells, we analyzed the percentage of cells showing Tor1 or Dcp2 accumulation in the foci at each time point. (C) Fractionation of stress granules or P-bodies under stress conditions. Cells expressing Pab1-TAP or Dcp2-TAP were treated with heat stress for 10 min or glucose starvation (-glu) for 30 min or pretreated with cycloheximide (CHX) for 10 min. (D) Fractionation of TORC1. GFP-Kog1 and GFP-Tor1 were expressed under the CET1 promoter. (E) Fractionation of Kog1. GFP-Kog1 and Ego1-GFP-Kog1 were expressed under the CET1 promoter. (F) RNA-mediated interaction between Tor1 and P-body components under glucose starvation conditions. GFP-Tor1 was expressed under the CET1 promoter. Cells were starved of glucose for 30 min. Cell lysates were treated with 50 µg/ml RNase A and incubated for 10 min at 37°C before immunoprecipitation (IP). The relative ratio of coimmunoprecipitated GFP-Tor1 to input GFP-Tor1 is shown below each lane. (G) Interaction between TORC1 and mRNAs. mRNAs from cells expressing the indicated proteins were precipitated by using oligo(dT) cellulose, and copurified proteins were detected. RNase A was treated for 10 min at 37°C before the addition of oligo(dT) cellulose. (H) Glucose-independent interaction between TORC1 and mRNAs. Cell lysates extracted from nonstarved or glucose-starved cells were incubated with oligo(dT) cellulose. IB, immunoblot. (I) Localization-dependent interaction between TORC1 and mRNAs. mRNAs from cells expressing HA-Tor1 or Ego1-HA-Tor1 were precipitated by using oligo(dT) cellulose, and copurified proteins were detected. The relative ratios of oligo(dT)-captured proteins to input proteins are represented as bars. Values represent the average of three independent experiments. Error bars represent SD. P values were determined by Student’s t test (***, P < 0.001; ns, not significant [P > 0.05]).

