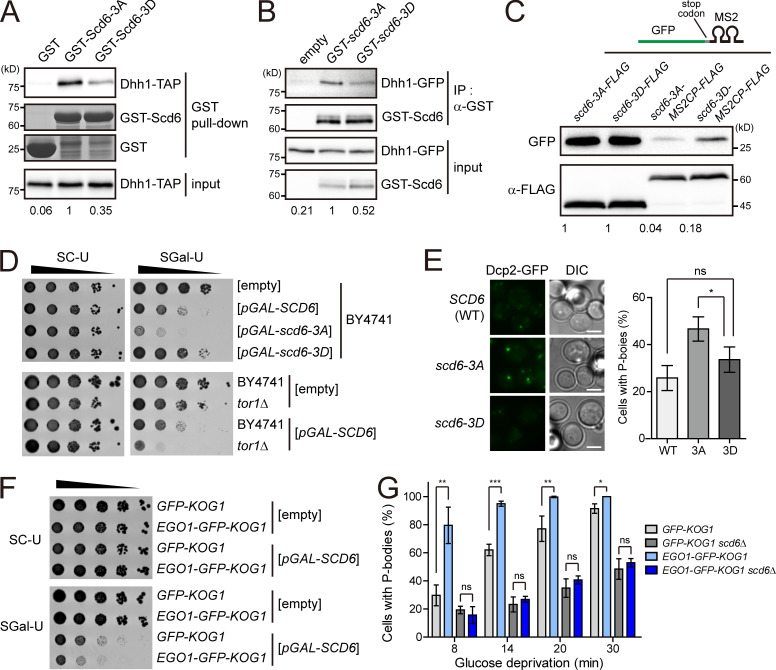
Figure 5.
TORC1 regulates the activity of Scd6 via phosphorylation. (A) In vitro GST pull-down assay with Scd6 mutants. E. coli–purified GST or GST-Scd6 mutants were incubated with lysates of cells expressing Dhh1-TAP. Dhh1-TAP was detected by immunoblotting. GST and GST-Scd6 mutants were visualized by Coomassie blue staining. (B) CoIP assay for the interaction between Dhh1 and Scd6. Dhh1-GFP coimmunoprecipitated with GST-Scd6 mutants was detected by Western blotting. The relative ratio of pulled-down or coimmunoprecipitated Dhh1-TAP to input Dhh1-TAP is shown below each lane. (C) Translational repression of the GFP reporter by tethering of Scd6 mutants. GFP-MS2 mRNAs were expressed under the ADH1 promoter and Scd6-3A/3D-FLAG or Scd6-3A/3D-MS2CP-FLAG were expressed under the TDH3 promoter. The relative ratio of GFP to FLAG-tagged protein is shown below each lane. (D) TORC1-dependent regulation of growth defect caused by Scd6 overexpression. Wild-type (BY4741) or tor1Δ cells harboring the indicated plasmids were spotted in 10-fold serial dilutions on SC-Ura (SC-U) and SGal-Ura (SGal-U) plates. (E) P-body formation in cells with Scd6 mutants under glucose starvation. Left: P-body formation was observed by fluorescence microscopy. scd6-3A and scd6-3D indicate cells expressing Scd6-3A and Scd6-3D, respectively. Cells were starved of glucose for 10 min. Scale bars, 2 µm. Right: Quantification of the ratio of cells with P-bodies (n > 200). (F) The effect of the vacuole-anchored TORC1 on growth defect caused by Scd6 overexpression. Cells expressing GFP-Kog1 or Ego1-GFP-Kog1 were transformed with the indicated plasmids and spotted in 10-fold serial dilutions on SC-Ura and SGal-Ura plates. (G) Increase in P-body formation in cells with the vacuole-anchored TORC1. Time-course images of cells expressing Dcp2-mCherry were taken at the indicated times after glucose starvation, and the ratio of cells with P-bodies was calculated using ImageJ software. Values represent the average of three independent experiments. Error bars represent SD. P values were determined by Student’s t test (*, P < 0.05; **, P < 0.01; ***, P < 0.001; ns, P > 0.05).

