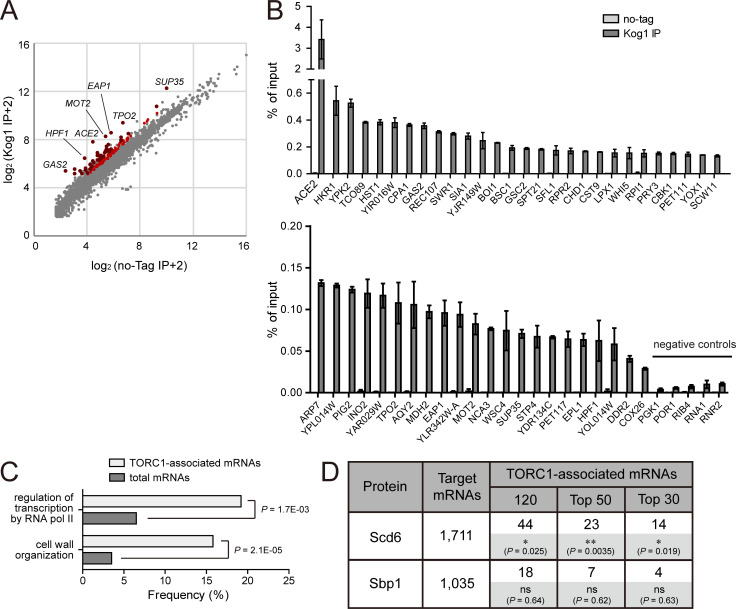
Figure 6.
TORC1-associated mRNAs significantly overlap with Scd6-interacting mRNAs. (A) RIP-seq analysis of Kog1. Reads per kilobase million value of each gene obtained from cells expressing HA-Kog1 (y axis) was plotted against that obtained from wild-type cells (x axis). Red dots indicate 120 mRNAs that were enriched in Kog1 immunoprecipitates, and dark red dots among them indicate the 50 most enriched mRNAs confirmed by quantitative real-time PCR. (B) RIP/quantitative real-time PCR assay for the 50 most enriched mRNAs among TORC1-associated mRNAs and five negative controls. The amounts of immunoprecipitated mRNAs are represented as percentage of input. Values represent the average of three independent experiments. Error bars represent SD. (C) GO analysis of 120 TORC1-associated mRNAs. GO analysis for biological process was performed using the GO term finder (Boyle et al., 2004). (D) Comparison of TORC1-associated mRNAs with those interacting with Scd6 and Sbp1. The numbers of overlapped mRNAs are represented. P values were determined by Fisher’s exact test (*, P < 0.05; **, P < 0.01; ns, P > 0.05).

