Figure S1.
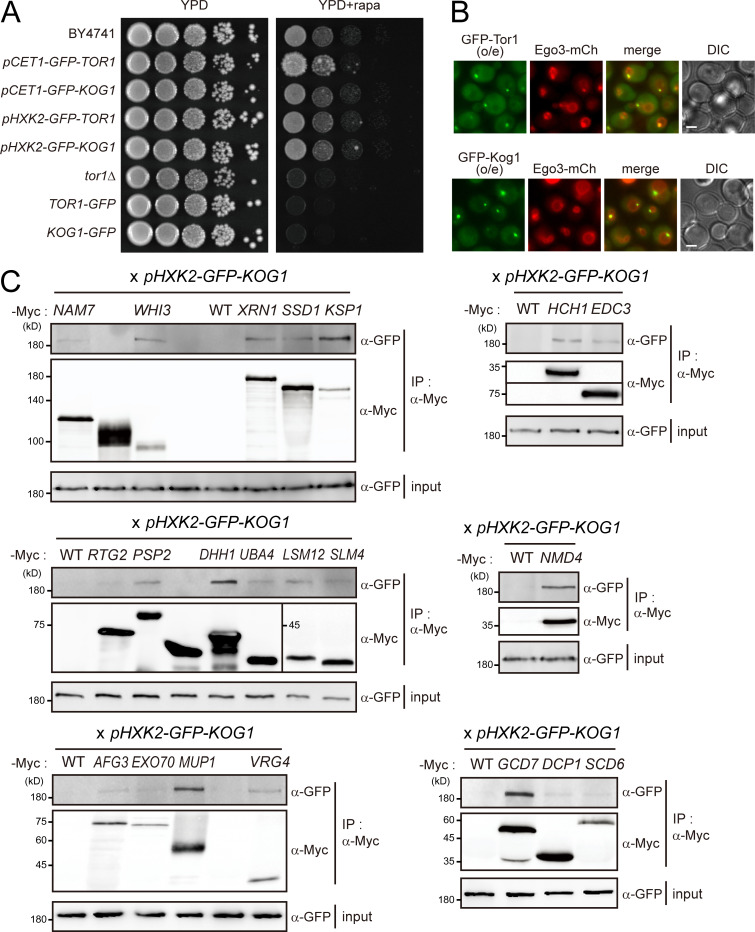
Interactome analysis of TORC1. (A) Impaired TORC1 activity by C-terminally tagging to Tor1 or Kog1. (B) Localization of overexpressed TORC1 at the vacuolar membrane. o/e indicates overexpression under the HXK2 promoter. Scale bars, 1 µm. (C) CoIP assay of Kog1 interactors. C-terminally Myc-tagged proteins were immunoprecipitated, and coimmunoprecipitated GFP-Kog1 was detected. GFP-Kog1 was expressed under the HXK2 promoter. The coIP assay for seven interactors is shown in Fig. 1 D.

