Figure S2.
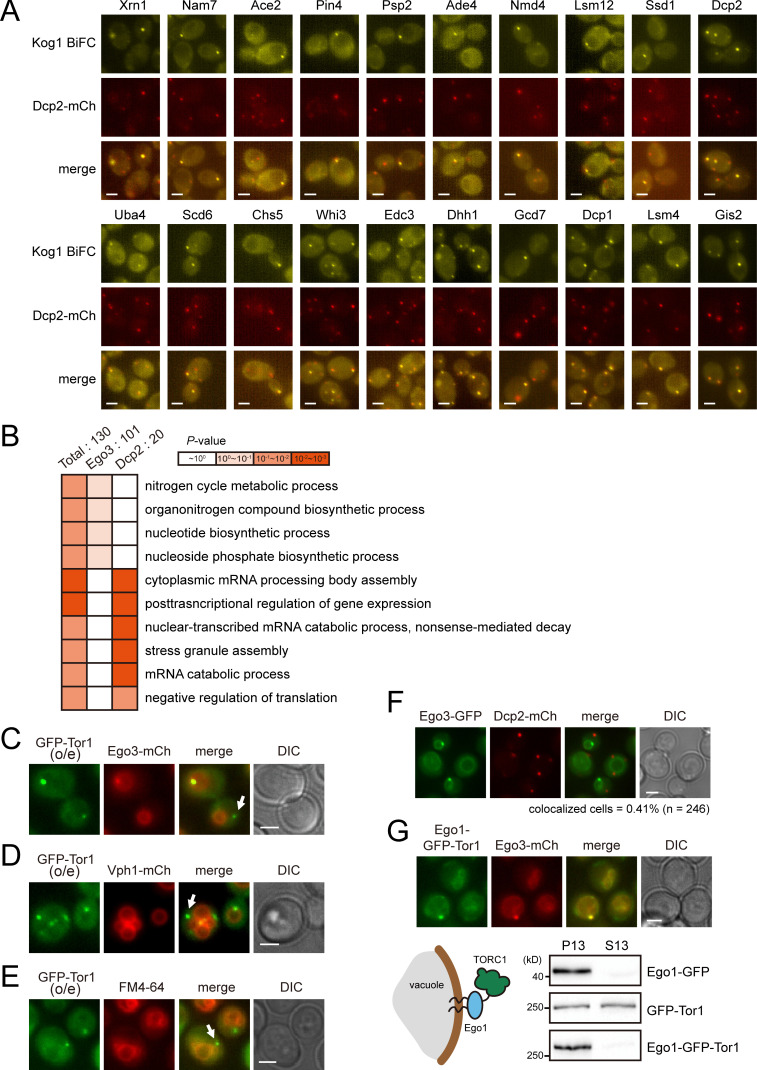
Foci accumulation of the BiFC signals for the TORC1 interactome. (A) 20 proteins that have interaction with Kog1 in P-bodies. MATα VN fusion strains were mated with a MATα strain expressing VC-KOG1 and DCP2-mCherry. Cells were starved of glucose for 30 min before fluorescence microscopy. (B) GO analysis of Kog1 interactors colocalizing with Ego3 and those colocalizing with Dcp2. GO analysis for biological process was performed using the PANTHER classification system. (C–E) Detection of a portion of Tor1 foci outside the vacuolar membrane. GFP-Tor1 was expressed under the HXK2 promoter. Fluorescence signals were detected under normal growth conditions. Arrows indicate Tor1 foci that were not localized to the vacuolar membrane. (F) Different localization of Ego3 and P-bodies. Cells were starved of glucose for 30 min before fluorescence microscopy. (G) Anchorage of TORC1 to the vacuolar membrane by conjugating Ego1 to Tor1. Top: Colocalization between Ego1-conjugated Tor1 and Ego3. Fluorescence signals were detected under normal growth conditions. Bottom: Fractionation of Tor1. Subcellular fractionation was performed by centrifugation at 13,000×g. Western blotting was performed with anti-GFP antibody. Scale bars, 2 µm.

