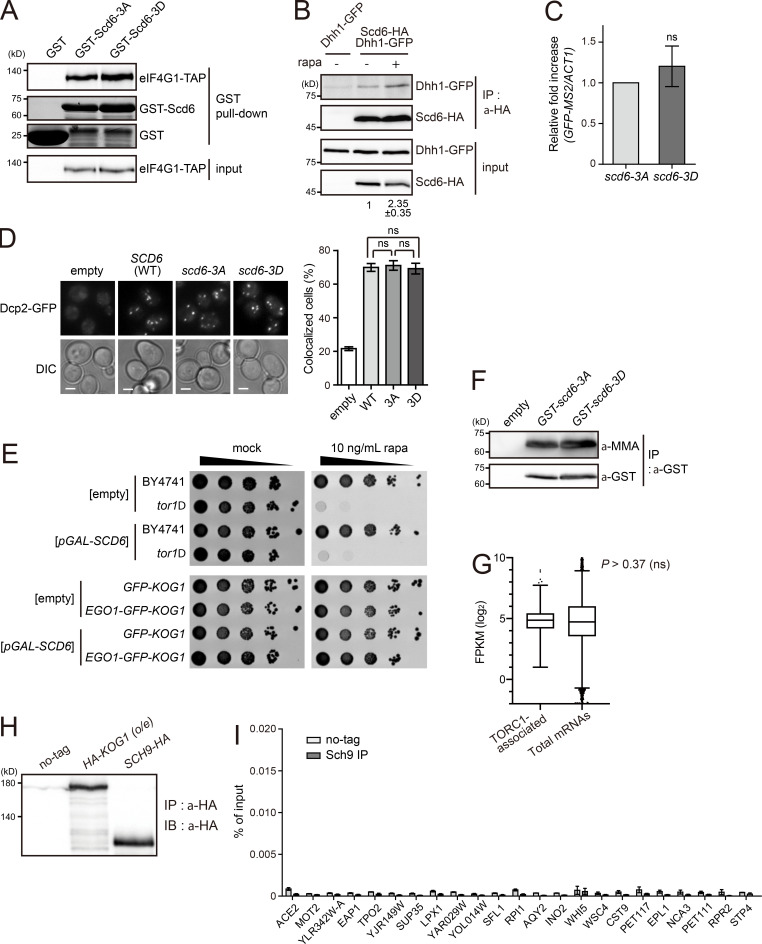
Figure S5.
Phenotypes of scd6-3A and scd6-3D mutants. (A) Interaction of Scd6 mutants with eIF4G. E. coli–purified Scd6 mutants were incubated with lysates from cells expressing TIF4631-TAP. (B) Increased interaction between Scd6 and Dhh1 under TORC1 inhibition by rapamycin (rapa). The relative ratio of coimmunoprecipitated Dhh1-GFP to input Dhh1-GFP was calculated, and the mean ± SD of duplicate experiments is shown below each lane. (C) Effects of tethering of Scd6 mutants on the stability of GFP mRNAs. GFP-MS2 mRNAs were expressed under the ADH1 promoter, and Scd6 mutants were expressed under the TDH3 promoter. The mRNA levels of GFP-MS2 were normalized against to those of ACT1. P values were determined by Student’s t test (ns, P > 0.05). (D) P-body formation in cells overexpressing Scd6 mutants. Cells harboring p426GAL-SCD6 vectors were grown in 2% raffinose-containing media and Scd6 was induced by the addition of 2% galactose for 1.5 h. Scale bars, 2 µm. Right: Quantification of the ratio of cells with P-bodies. More than 200 cells were counted for each experiment. Values represent the average of three independent experiments. P values were determined by Student’s t test (ns, P > 0.05). (E) Effect of the vacuolar membrane anchoring of TORC1 on its activity. Cells were spotted in 10-fold serial dilutions on SC-Ura plates in the absence or presence of 10 ng/ml rapamycin. (F) Arginine methylation of Scd6 mutants. Scd6 was purified from cells expressing GST-Scd6-3A or GST-Scd6-3D, and arginine methylation was detected by anti-mono and dimethyl arginine (MMA) antibody (Abcam; ab412). (G) Expression levels of TORC1-associated mRNAs and total mRNAs. The whiskers represent the 5th and the 95th percentiles. P value was determined by Mann-Whitney U test. (H) Western blotting of Kog1 and Sch9 showing that the amount of immunoprecipitated Sch9 was not significantly different from that of immunoprecipitated Kog1 used in Fig. 6 B. (I) Enrichment of all tested mRNAs in the Sch9 immunoprecipitates. The amounts of immunoprecipitated mRNAs were divided by the amounts of input mRNAs and are represented as percentage of input. Values represent the average of three independent experiments. All error bars represent SD.

