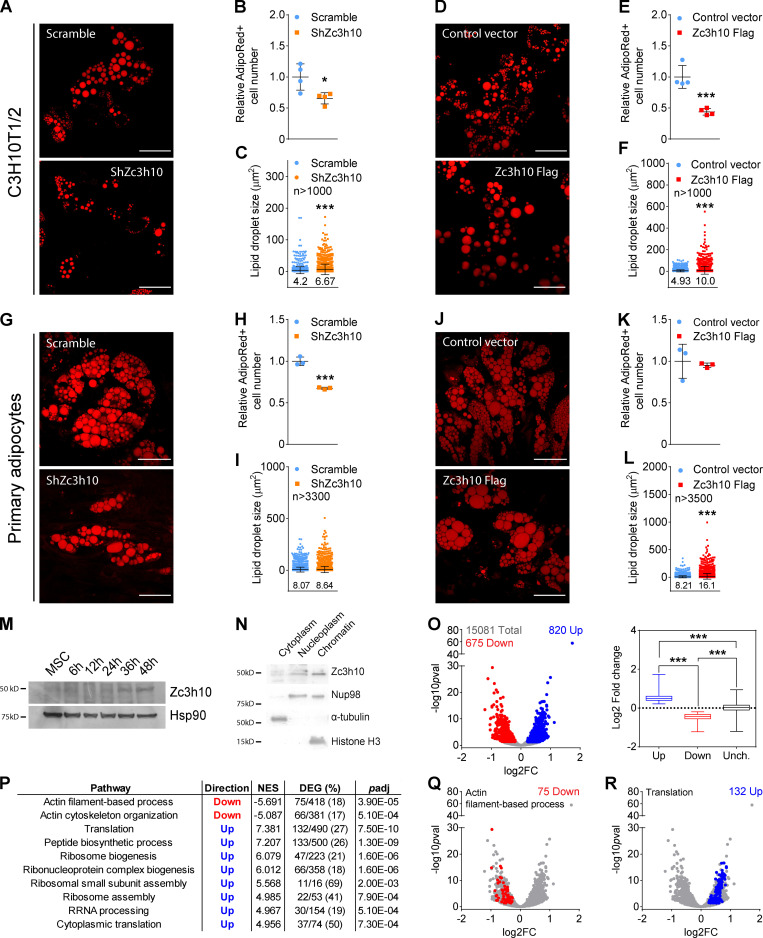
Figure 1.
Zc3h10 controls white adipogenesis and pre-mRNA transcription in preadipocytes. (A and D) Lipid droplets were labeled by using AdipoRed dye to evaluate lipid accumulation in mature adipocytes (day 9). Scale bar: 50 µm. (B and E) Relative quantification of AdipoRed-positive (AdipoRed+) cells in mature adipocytes (day 9). n = 4; unpaired parametric Student’s t test; *P < 0.05 vs. Scramble; ***P < 0.001 vs. Control. (C and F) Lipid droplet size adipocytes differentiated for 9 d. n > 1,000; unpaired and nonparametric Mann-Whitney test; ***P < 0.001 vs. Scramble/Control. (G and J) Primary stromal vascular cell (SVC) differentiation was evaluated in Scramble and ShZc3h10 mature adipocytes (day 8) by using AdipoRed dye. Scale bar: 50 µm. (H and K) AdipoRed+ cell counts in Scramble and ShZc3h10 primary adipocytes (day 8). n = 3; unpaired parametric Student’s t test; ***P < 0.001 vs. Scramble. (I and L) Lipid droplet size in primary mature adipocytes (day 8). n > 3,300 ShZc3h10; n > 3,500 Zc3h10 Flag; unpaired nonparametric Mann-Whitney test; ***P < 0.001 vs. Control. (M) Western blot of Zc3h10 in whole-cell lysates during the first 48 h of differentiation. (N) Western blot of Zc3h10, Nup98 (nuclear marker), α-tubulin (cytoplasmic marker), and histone H3 (chromatin marker) in the indicated cell fractions 36 h after differentiation induction. (O) Volcano and box plots of downregulated (red), upregulated (blue), and unchanged (gray) pre-mRNAs in ShZc3h10 preadipocytes at 36 h. Scramble: n = 2; ShZc3h10: n = 3; volcano plot: false discovery rate (FDR) < 0.05; box plot: Kruskal-Wallis test of rank with Dunn’s post-hoc test; ***P < 0.001 vs. Scramble. (P) GAUGE analysis results of significantly down- and upregulated pre-mRNA clusters in ShZc3h10 36-h-differentiated preadipocytes. Table indicates pathway name, trend, normalized enrichment score (NES), number of differentially expressed genes (DEGs) along with their percentage of the total genes in the cluster, and adjusted P value (padj). (Q) Volcano plot of the actin filament–based process cluster genes. Red dots represent DEGs that were significantly downregulated (FDR < 0.05) in ShZc3h10 cells 36 h after differentiation induction. (R) Volcano plot of the translation gene cluster. Genes that were significantly upregulated (FDR < 0.05) in ShZc3h10 preadipocytes 36 h after differentiation induction are shown in blue.

