Figure 3.
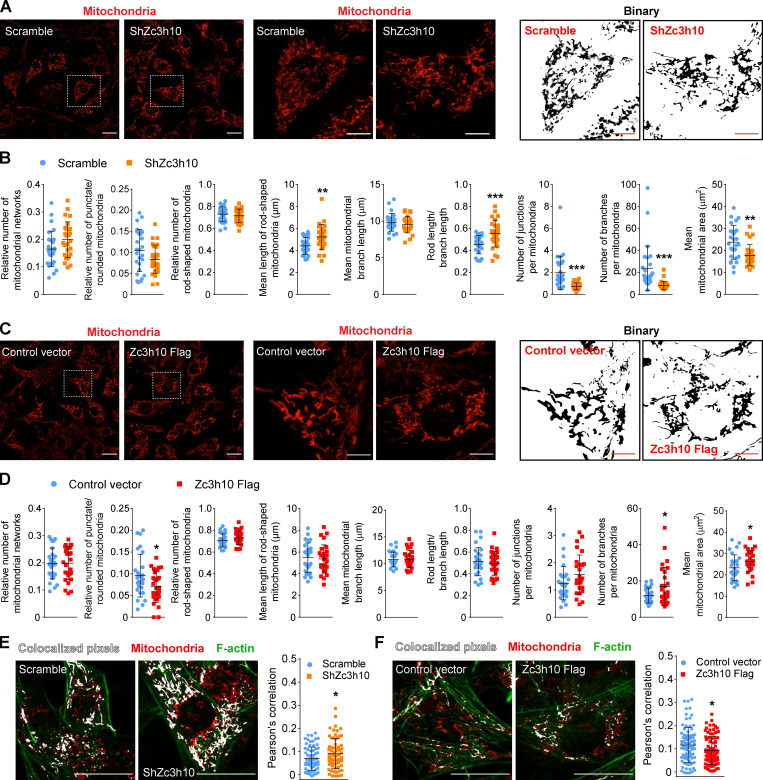
Zc3h10-mediated F-actin remodeling determines mitochondrial network complexity. (A and C) Left: Representative confocal images of mitochondria detected by the Mitotracker Red CM-H2XROS probe preadipocytes (36 h). Middle and right: Enlarged images (middle) and relative binary (right) are also shown. Scale bar: 50 µm (left), 10 µm (middle and right). (B and D) Quantitative analysis of mitochondrial networks in preadipocytes (36 h). n = 27 cells in ShZc3h10; n = 28 cells in Zc3h10-Flag; unpaired parametric Student’s t tests; **P < 0.01, ***P < 0.001 vs. Scramble, *P < 0.05 vs. Control vector. (E and F) Colocalization analysis of mitochondria (red) and F-actin (green) in 36-h-differentiated cells. n = 68 cells in ShZc3h10; n = 85 cells in Zc3h10-Flag; unpaired parametric Student’s t test; *P < 0.05 vs. Scramble/Control. Scale bar: 25 µm.

