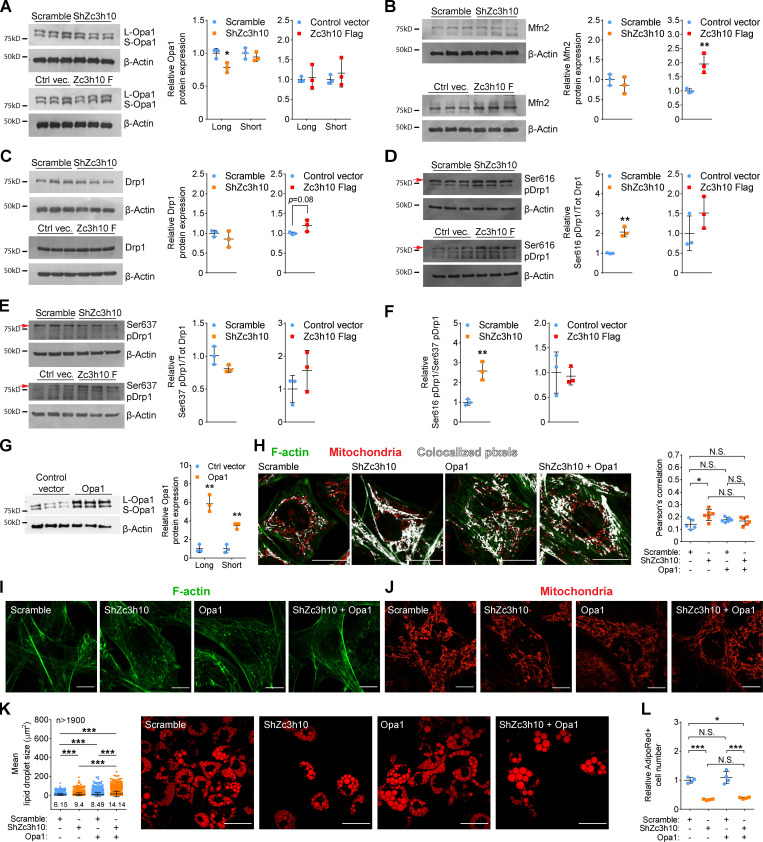
Figure 4.
Zc3h10 impacts mitochondrial dynamics and function. (A–E) Representative Western blots of Opa1 (A), mitofusin 2 (Mfn2; B), total Drp1 (C), Drp1 pSer616 (D), and pSer637 (E) with the relative quantifications in preadipocytes (36 h). n = 3; unpaired parametric Student’s t tests; *P < 0.05 vs. Scramble (A); **P < 0.01 vs. Control (B); **P < 0.01 vs. Scramble (D). The β-actin used for the phosphorylation status of Drp1 (D and E) is identical to that used to assess the phosphorylation status of 4E-BP1 reported in Fig. 8, D and E since the samples were evaluated on the same membranes. (F). pSer616/pSer637 Drp1 ratio in preadipocytes (36 h). n = 3; unpaired parametric Student’s t tests; **P < 0.01 vs. Scramble. (G) Overexpression levels of Opa1 in preadipocytes (36 h) with relative quantifications of long and short isoforms. n = 3; unpaired parametric Student’s t tests; **P < 0.01 vs. Control vector (vec). (H) Representative confocal images of preadipocytes (36 h) for colocalization analysis of mitochondria and F-actin. n = 5 for Scramble and n = 6 for the other conditions; one-way ANOVA followed by Tukey’s post-hoc test; *P < 0.05. Scale bar: 25 µm. (I and J) Representative confocal images of F-actin (I) and mitochondria (J) in preadipocytes (36 h) expressing the indicated molecules. Scale bar: 25 µm. (K) Lipid droplet size in mature adipocytes (9 d) overexpressing Opa1; n > 1,900 lipid droplets; statistical analysis was performed by one-way ANOVA followed by Tukey’s post-hoc test; ***P < 0.001. Scale bar: 25 µm. (L) Relative quantification of AdipoRed+ cells in mature adipocytes (9 d). n = 4; one-way ANOVA followed by Tukey’s post-hoc test; *P < 0.05; ***P < 0.001.

