Figure 5.
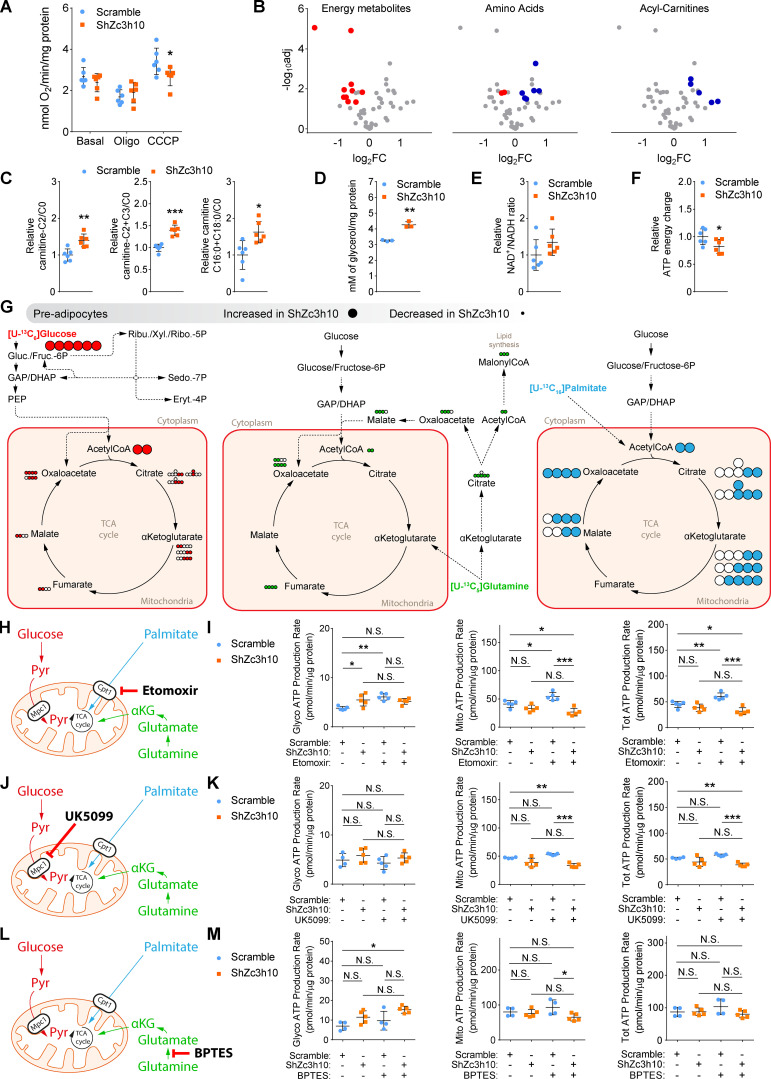
Zc3h10 orchestrates mitochondrial energy metabolism in preadipocytes. (A) Basal, uncoupled (Oligo), and maximal uncoupled respiration (CCCP) in preadipocytes (3 d). n = 6; unpaired parametric Student’s t tests; *P < 0.05 vs. Scramble. (B) Volcano plots representing significantly decreased (red dots), increased (blue dots), and unchanged (gray dots) energy metabolites, amino acids, and acyl-carnitines in preadipocytes (3 d). n = 6; unpaired parametric multiple Student’s t tests followed by false discovery rate (FDR) correction; FDR < 0.05 vs. Scramble. (C) C2 acyl-carnitine/free carnitine (C0; left), C2+C3 acyl-carnitines/C0 (middle), and C16:0+C18:0 acyl-carnitines/C0 (right) ratios in preadipocytes (3 d). n = 6; unpaired parametric Student’s t tests; *P < 0.05, **P < 0.01, ***P < 0.001 vs. Scramble. (D) Glycerol quantification in the media of preadipocytes (3 d). Glycerol concentrations were normalized to cellular protein content. n = 3; unpaired parametric Student’s t test; **P < 0.01 vs. Scramble. (E and F) NAD+/NADH ratio (E) and ATP energy charge (F) in preadipocytes (3 d). n = 6; unpaired parametric Student’s t tests; *P < 0.05 vs. Scramble. (G) Schematic representation of metabolic flux analyses in preadipocytes (3 d). Red, green, and light blue dots represent labeled carbons originating from [U-13C6]glucose, [U-13C5]glutamine, and [U-13C16]palmitate, respectively. Big and small dots represent increased and decreased labeling, respectively, of the indicated isotopomer in ShZc3h10 compared with Scramble cells. (H, J, and L) Schematic representation of etomoxir (H), UK5099 (J), and BPTES (L) mechanism of action. (I, K, and M) Glycolytic (left), mitochondrial (middle), and total ATP levels (right) calculated by the Seahorse XFp Real-Time induced ATP Rate Assay in preadipocytes (3 d) treated with 4 µM etomoxir (I), 2 µM UK5099 (K), and 3 µM BPTES (M). n = 5; one-way ANOVA followed by Tukey’s post-hoc test; *P < 0.05, **P < 0.01, ***P < 0.001. αKG, α-ketoglutarate.

