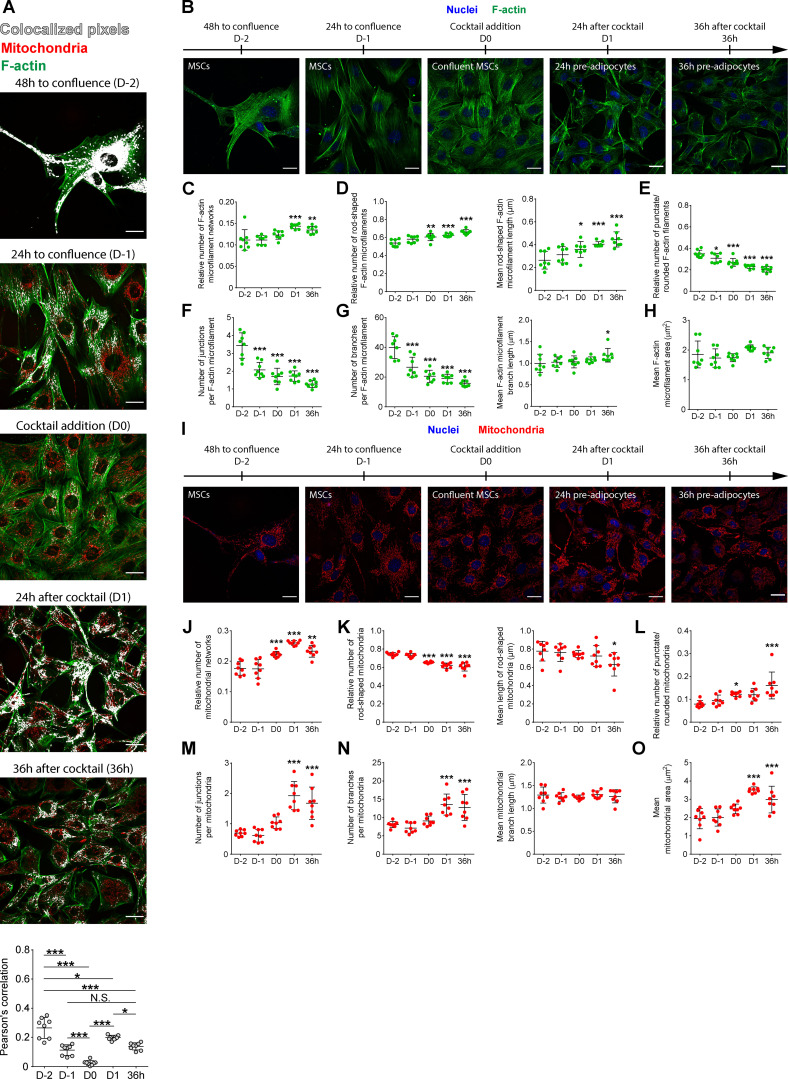
Figure S2.
Morphology of F-actin, mitochondrial networks, and their colocalization during the early stages of adipogenesis. (A) Representative images and quantitative analysis of mitochondria/F-actin colocalization in the early phases of adipogenesis (from proliferating MSCs to 36-h-differentiated preadipocytes). Red: mitochondria; green: F-actin; white: colocalized pixels. n = 8; statistical analysis was performed by using one-way ANOVA followed by Tukey’s post-hoc test; *P < 0.05, ***P < 0.001. Scale bar: 25 µm. (B–H) Representative images (B) and quantitative analysis of F-actin networks (C–H) during the early phases of C3H10T1/2 differentiation to adipocytes (from proliferating MSCs to 36-h-differentiated preadipocytes). Green: F-actin; blue: nuclei. n = 8; statistical analysis was performed by using one-way ANOVA followed by Dunnett’s post-hoc test; *P < 0.05, **P < 0.01, ***P < 0.01 vs. D-2. Scale bar: 25 µm. (I–O) Representative images (I) and quantitative analysis of mitochondrial networks (J–O) during the early phases of adipogenesis (from proliferating MSCs to 36-h-differentiated preadipocytes). Red: mitochondria; blue: nuclei. n = 8; statistical analysis was performed by using one-way ANOVA followed by Dunnett’s post-hoc test; *P < 0.05, **P < 0.01, ***P < 0.01 vs. D-2. Scale bar: 25 µm.

