Figure S4.
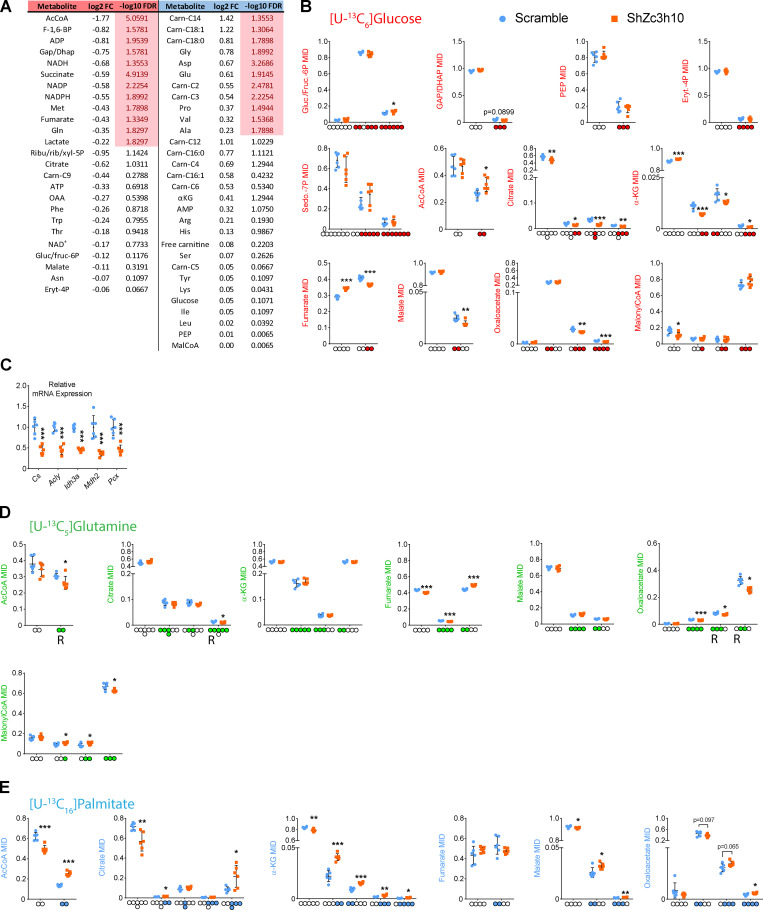
Zc3h10 regulates metabolite levels and metabolic flux in the TCxA cycle of preadipocytes. (A) Targeted metabolomics results in preadipocytes (3 d) indicating log2 fold change and −log10 adjusted P value for each metabolite. Red and blue legends indicate down- and upregulated molecules, respectively, while significantly changed metabolites are highlighted in pink. n = 6; statistical analysis was performed by using unpaired parametric multiple Student’s t tests followed by false discovery rate (FDR) correction; FDR < 0.05 vs. Scramble. (B) [U-13C6]Glucose-derived isotopomers in preadipocytes (3 d). Red dots indicate labeled carbons. n = 6; statistical analysis was performed by using unpaired parametric Student’s t tests; *P < 0.05, **P < 0.01, ***P < 0.01 vs. Scramble. (C) mRNA expression levels of the indicated genes in Scramble and ShZc3h10 in preadipocytes (3 d). n = 6; statistical analysis was performed by using unpaired parametric Student’s t tests; ***P < 0.01 vs. Scramble. (D) [U-13C5]Glutamine-derived isotopomers in preadipocytes (3 d). Green dots indicate labeled carbons. n = 6; statistical analysis was performed by using unpaired parametric Student’s t tests; *P < 0.05, ***P < 0.01 vs. Scramble. (E) [U-13C16]Palmitate-derived isotopomers in preadipocytes (3 d). Light blue dots indicate labeled carbons. n = 6; statistical analysis was performed by using unpaired parametric Student’s t tests; *P < 0.05, **P < 0.01, ***P < 0.01 vs. Scramble. αKG, α-ketoglutarate. MID, mass isotopomer distribution.

