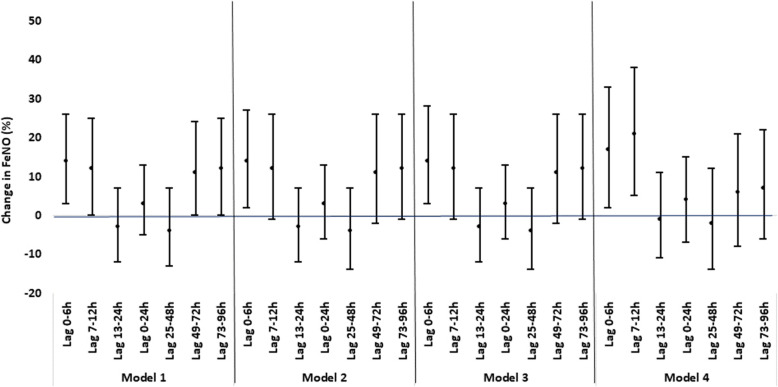
Fig. 1.
Percent Change of FeNO (and 95% CIs) per Log-transformed IQR Increase in BC at Different Lag Period. Depending on the lag period and model, the number of observations ranged from 64 to 89. Model 1 was the unadjusted model. Model 2 adjusted for day-of-week and week number when FeNO data were collected. Model 3 further adjusted for age, gender and race/ethnicity. Model 4 further adjusted for NO2. The IQR (μg/m3) was 3.83 for lag 0-6 h, 3.91 for lag 7-12 h, 3.07 for lag 13-24 h, 2.45 for lag 0-24 h, 3.42 for lag 25-48 h, 3.43 for lag 49-72 h and 2.95 for lag 73-96 h

