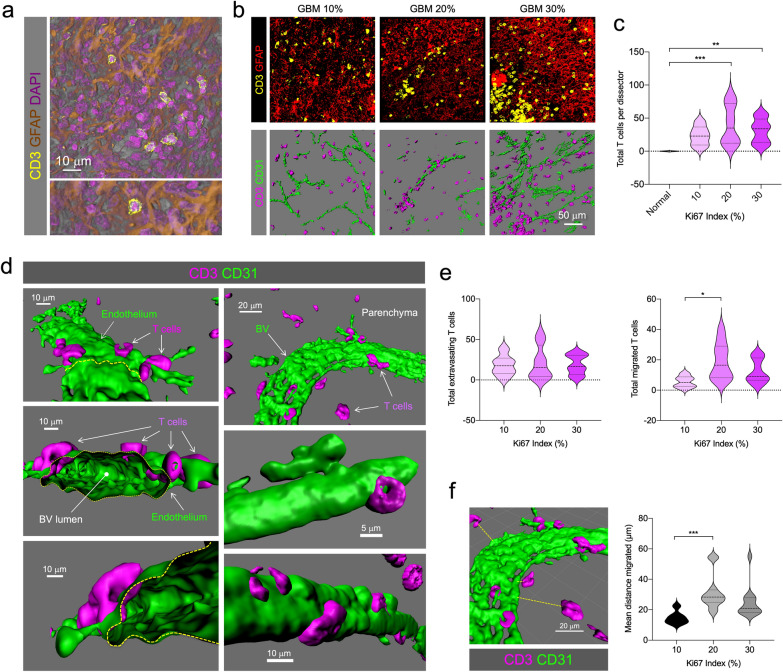
Fig. 6.
Increased T cell infiltration and migration in GBM. a Representative T cell infiltration in GFAP+ areas. Higher magnification of a CD3+ T cell is seen in the bottom panel. b Representative images of CD3+ T cell infiltration (yellow) and GFAP expression (red) in GBM patients with 10, 20 or 30% Ki67 indices as determined by neuropathological examination. Bottom panel shows the rendering of T cells (magenta) and CD31+ endothelium (green). c T cell quantification in GBM patients. d Three-dimensional analysis of T cell position with respect to endothelium distinguishes extravasating T cells (in diapedesis) or migrated into the tumorigenic parenchyma. e Quantification of extravasating and migrated T cells. f Quantification of the distance travelled from the closest endothelium

