Fig. 8.
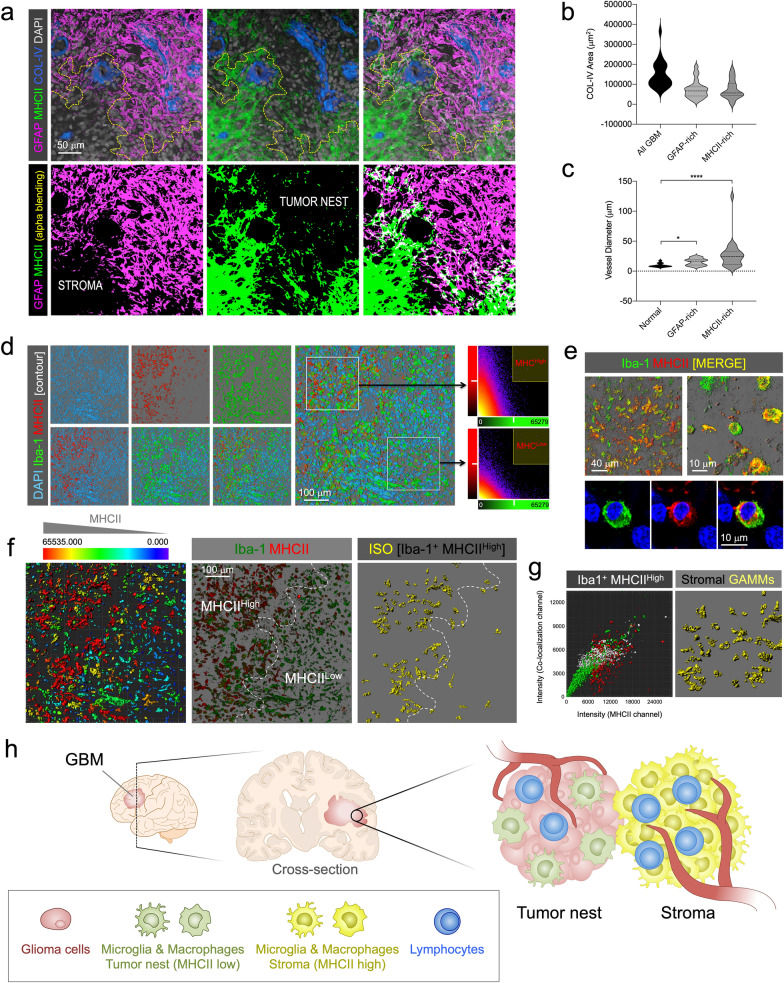
Distinct neuro-inflammatory profile of GAMMs in stroma and tumor nest. a GFAP (magenta) and MHCII (green) label tumor nest and stroma, respectively, as mutually exclusive niches in GBM. COL-IV blood vessels (blue) and cell nuclei (gray) are also marked. b Vascular volume of stroma (MHCII-rich) and tumor nest (GFAP-rich) suggested equal perfusion. c Vessels in stroma (MHCII-rich) have larger calibers than in tumor nest (GFAP-rich). d Segmentation by contour of MHCII (red) and Iba-1 (green) cells from a GBM confocal stack. DAPI was used as counterstain (cyan). Fluorescence intensity of the green and red channels plotted in MHCIIHigh and MHCIILow profiles. e Top panels show confocal alpha-blended images of Iba-1 (green) and MHCII (red) labeling combination in GBM samples to visualize colocalizing cells (yellow: colocalization). Bottom panels show a high-resolution optical slide of an Iba-1/MHCII-expressing GAMM. DAPI (blue) was used for counterstaining. f Categorization of segmented MHCII+ cells according to MHCII intensity. Selection of segmented Iba-1+ with high intensity of MHCII. g Left. Cytohistometry graph of Iba-1+ (green) and MHCII+ (red) cells showing the selection of Iba-1+/MHCIIHigh (white) as stromal GAMMs. Right. Selected cells highlighted in the image (yellow). h Diagram of the GAMM neuroinflammatory profile distribution in tumor nest and stroma

