Fig. 3.
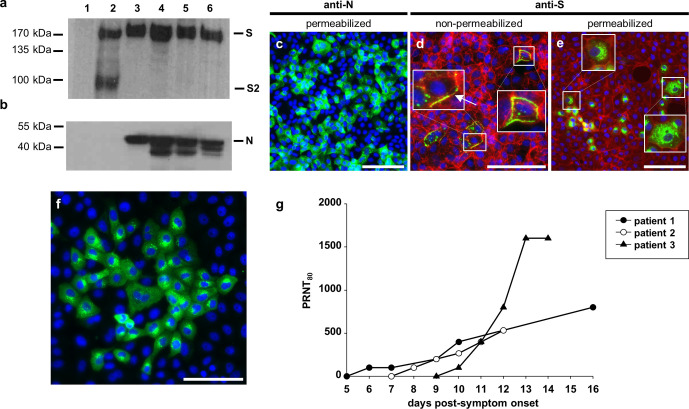
Antibody studies. (a, b) Western blot analysis of SARS-CoV-2-infected Vero E6 cell lysates. Vero E6 cells were infected with Wash1 : P5 (lane 3) or P6 (lane 4) stock or Munich : P2 (lane 5) or P3 (lane 6) stock. Mock cell lysate prepared from cells transfected with a pCAGGS vector expressing EGFP (lane 1) and a lysate prepared from cells transfected with a pCAGGS vector expressing a codon-optimized S protein (lane 2) were included as a negative and positive control, respectively. SARS-CoV-2 S protein and the S2 subunit (a), and the N protein (b), were detected with a SARS coronavirus spike protein polyclonal antibody or SARS coronavirus N protein monoclonal antibody, respectively, and HRP-conjugated secondary. The predicted full-length S, S2 subunit and full-length N are indicated based on the marker sizes. Loading of cell lysates was adjusted to show equal levels of virus proteins. Equal amounts of protein were loaded for the pCAGGS EGFP control and pCAGGS S protein expression vectors. (c–e) Virus protein distribution in Munich : P3-infected Vero E6 cells at 24 h post-infection, visualized by immunodetection of N protein (c; green) or S protein (d and e; green) in permeabilized (c, e) or non-permeabilized (d) cells. Filamentous (f)-actin (d, e) and/or nuclei (c–e) were counterstained with phalloidin (red) and DAPI (blue), respectively. Areas marked by white boxes are shown at higher magnification in the insets (d, e). An arrow marks S protein distributed across the cell membrane of an infected cell (d). Scale bars represent 100 µm. (f) Virus protein distribution in permeabilized, Munich : P3-infected Vero E6 cells at 24 h post-infection, visualized by immunodetection with human serum (patient 3, day 14; Table 1; green). Nuclei were counterstained with DAPI (blue). The scale bar represents 100 µm. (g) Development of neutralizing antibodies against SARS-CoV-2 Munich : P3 virus stock in sequential human serum samples collected during the acute phase of COVID-19. Mean PRNT80 values are joined by lines.

