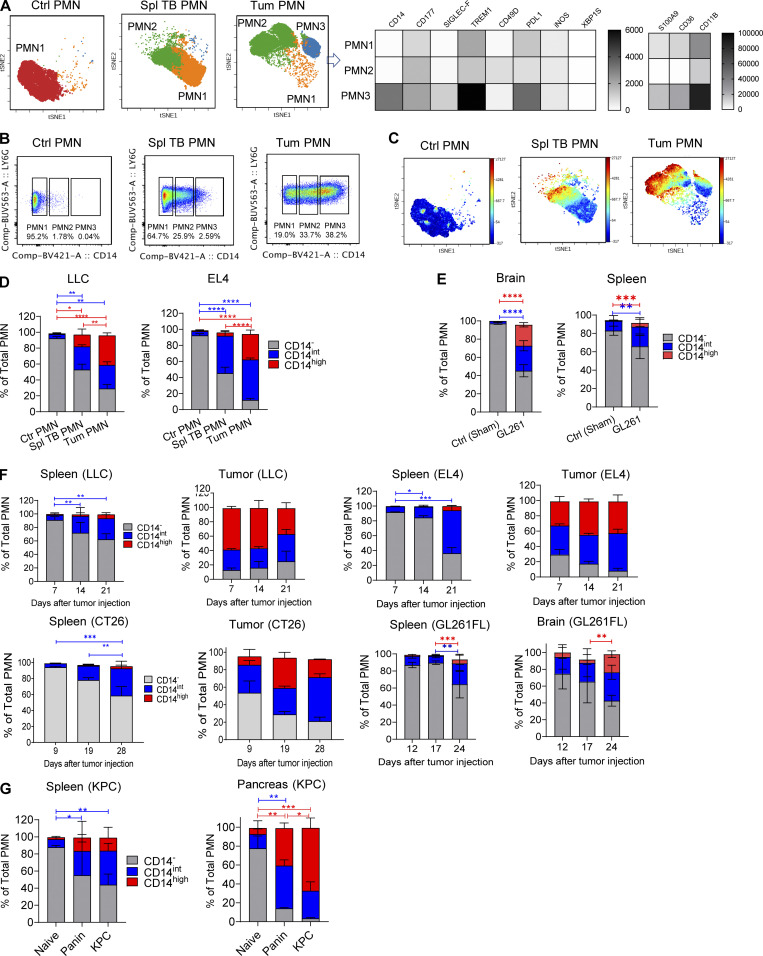
Figure 3.
CD14 expression delineates three populations of PMNs in TB mice. (A) FlowSOM clusters overlaid on a viSNE plot of PMN (left). Five samples (five mice) per group from five independent experiments were concatenated before applying viSNE and FlowSOM. Heatmap generated using raw median value of each marker expressed in each cluster identified (right). Spl, spleen; Tum, tumor. (B) Flow cytometric analysis of the expression of CD14 on tumor-associated PMNs. Typical result of five experiments is shown. (C) Expression of CD14 in FlowSOM clusters overlaid on viSNE plot. Typical example of five experiments is shown. (D) Frequency of CD14−, CD14int, CD14high PMNs in spleens of control mice and spleens and tumors of LLC and EL4 TB mice (n = 5–8 mice per group, from three independent experiments). Data are presented as mean ± SD. For comparisons between groups, ANOVA with correction for multiple comparisons was used. *, P < 0.05; **, P < 0.01; ****, P < 0.0001. (E) GL261FL cells or vehicle were injected intracranially into mice. Frequency of PMN subsets in control and TB mice, analyzed by flow cytometry. Mean and SD are shown (n = 3). Experiments were reproduced twice. **; P < 0.01; ***, P < 0.001; ****, P < 0.0001 in two-sided Student’s t test. (F) Kinetics of expansion of PMNs in spleen and tumors of indicated tumor models (n = 5 mice per group, from five independent experiments). *, P < 0.05; **, P < 0.01; ***, P < 0.001. (G) Expansion of PMNs in spleen and pancreatic tumors of KPC mice (n = 5 mice per group from three experiments). Data are presented as mean ± SD. For comparisons between groups, ANOVA with correction for multiple comparisons was used. *, P < 0.05; **, P < 0.01; ***, P < 0.001; ****, P < 0.0001.

