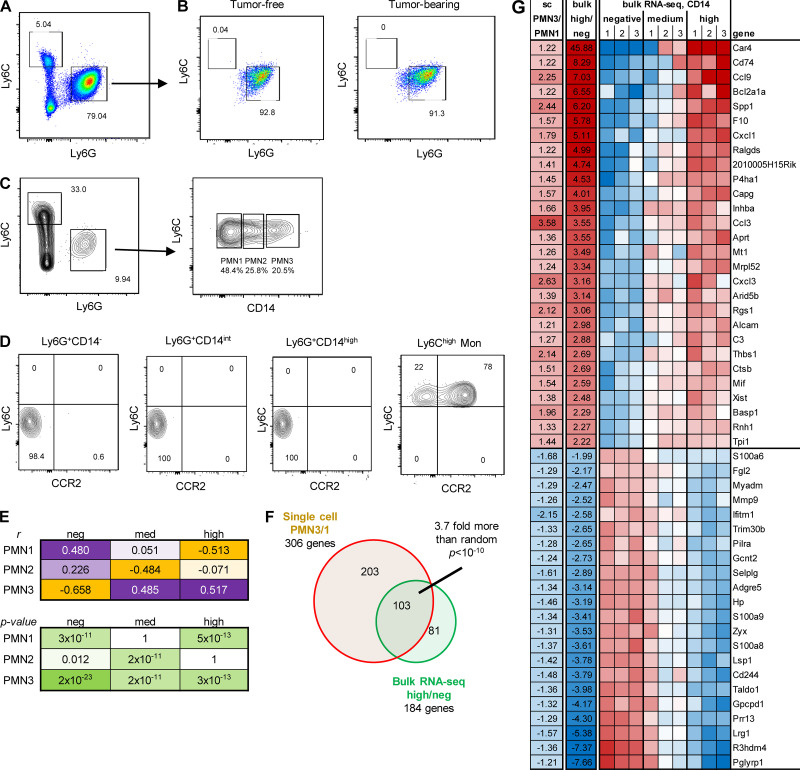
Figure 4.
Characteristics of PMNs with different expression of CD14. PMNs were sorted from BM obtained from control and GL261FL TB mice and cultured for 24 h in the presence of GM-CSF. (A) Representative gating strategy used for sorting. (B) Frequency of monocytic cells differentiated from PMNs isolated from tumor-free or TB mice. Experiments were performed twice with the same results. (C and D) Myeloid cells were isolated from GL26FL tumors on day 24 after tumor injections. (C) Gating strategy used for the identification of PMNs and their subsets in brain tumor tissue. (D) M-MDSC (Ly6ChighLy6G−CCR2+) present in different populations of PMNs. Ly6Chigh M-MDSC were used as positive controls of staining. Experiments were performed three times with the same results. (E) Correlation between three main single-cell clusters and three CD14 level groups from bulk RNA-seq. Correlation was done on 185 genes that passed FDR <5% threshold in both single-cell and bulk RNA-seq. (F) Overlap between single-cell PMN3/1 clusters and bulk RNA-seq high/negative CD14 cells. (G) Top 50 genes overlapped between single-cell and bulk RNA-seq in comparison between PMN3 versus PMN1 and high versus low CD14.

