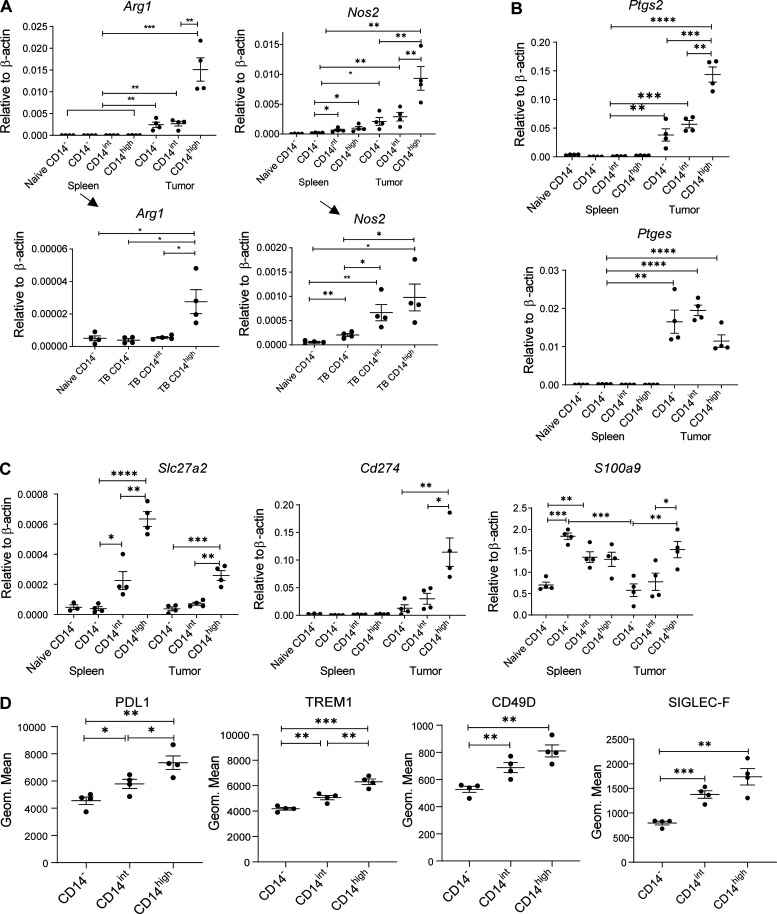
Figure 5.
Expression of genes related to PMN-MDSC activity in different populations of PMNs. (A–C) Expression of indicated genes by qPCR in different populations of PMNs isolated from spleen and tumors of LLC TB mice. Four experiments were performed. (D) Expression of selected markers by flow cytometry in the populations of PMNs from tumors of LLC TB mice (n = 4 per group). All data are presented as mean ± SD. P values were calculated in ANOVA with correction for multiple comparisons. *, P < 0.05; **, P < 0.01; ***, P < 0.001; ****, P < 0.0001.

