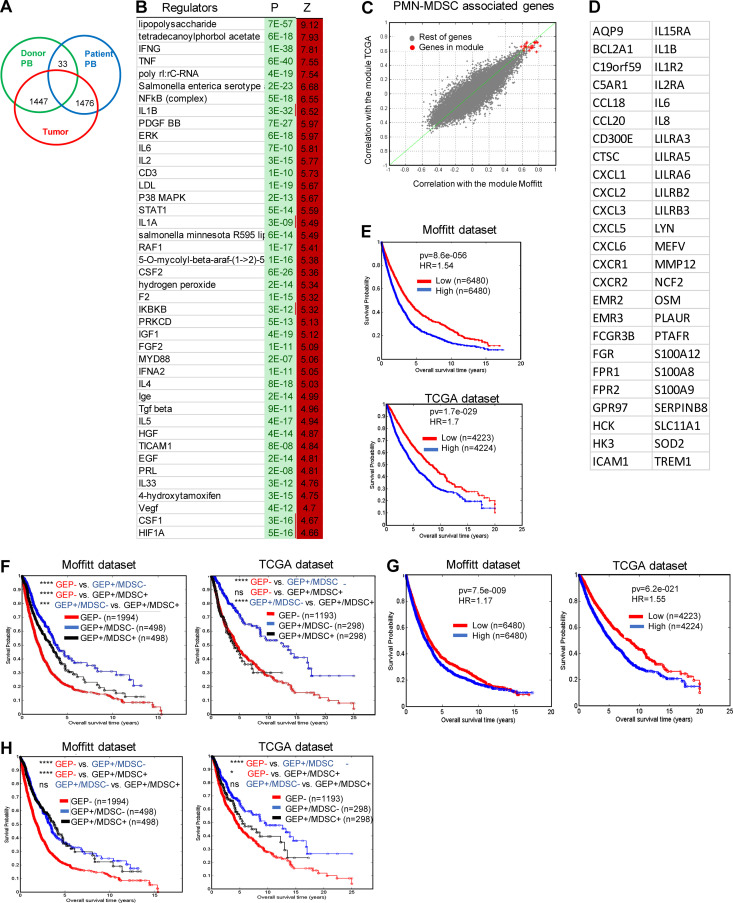
Figure 7.
GEP of human tumor PMNs. (A) The number of differentially expressed genes (FDR <5%) between PMNs isolated from peripheral blood and tumors. (B) Gene regulators enriched in tumor PMNs in comparison with peripheral blood PMNs from the same patients. (C and D) Genes found to be coexpressed with PMN-MDSC signature, with correlation coefficient >0.6 after analysis of TCGA and Moffitt datasets. (E) Association of PMN-MDSC signature with survival of patients in Moffitt and TCGA databases. (F) Association of PMN-MDSC signature with survival of patients with GEP of T cell infiltrated tumors. (G) Association of PMN signature with survival of patients. (H) Association of PMN signature with survival of patients with GEP of T cell infiltrated tumors. Number of samples analyzed, P values, and HRs are shown on graphs or presented as *, P < 0.05; ***, P < 0.001; ****, P < 0.0001.

