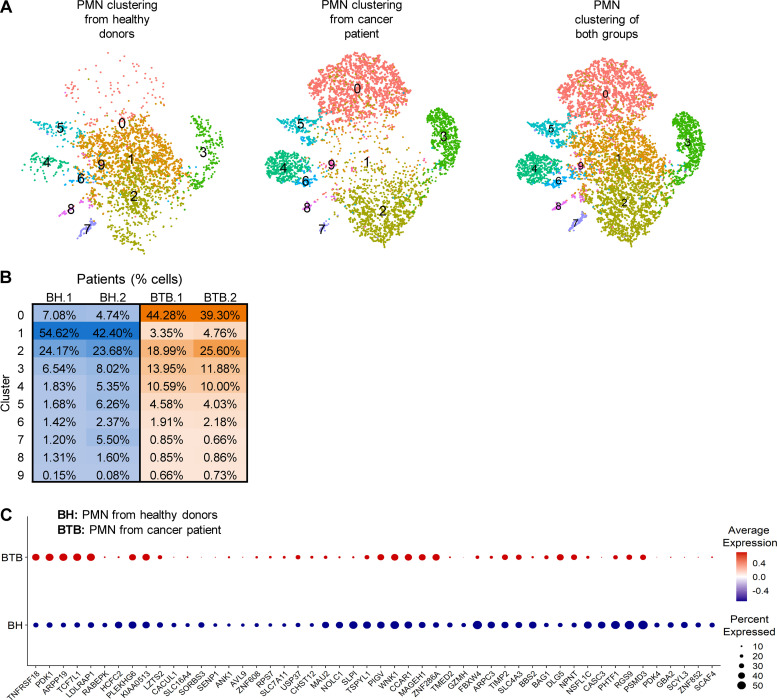
Figure 8.
Clustering of peripheral blood human PMNs. (A) t-SNE plots of cells clustering (n = 10 clusters) of PMNs from healthy donors and cancer patients. (B) Percentage distribution of PMN cells among different clusters. (C) Dot plot of PMN-MDSC–associated genes that are upregulated in PMN from cancer patients. The red and blue colors indicate up- and downregulated expression, respectively. BH, PMN from healthy donors; BTB, PMN from cancer patient.

