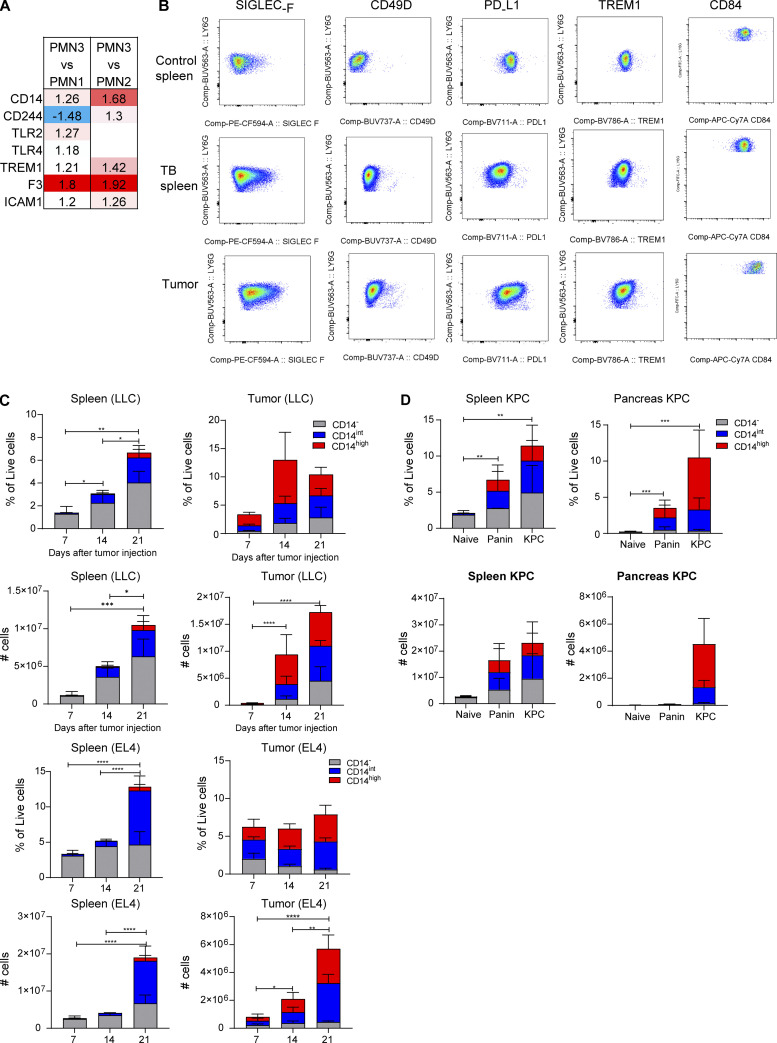
Figure S2.
Expression of cell surface markers on PMN-MDSCs from spleen and tumor. (A) Fold change of cell surface marker expression in PMN3 compared with PMN1 or PMN2. (B) Flow cytometric analysis of the expression of Siglec-F, CD49D, PD-L1, TREM1, and CD84 on PMNs from spleen and tumor. Dot plot representative of 5–8 mice analyzed. (C) Frequency in live cells and absolute number of the populations of PMNs from spleen and tumor of LLC- and EL4-bearing mice on days 7, 14, and 21 (five mice per group). (D) Frequency in live cells and absolute number of CD14−, CD14int, CD14high PMNs from spleen and pancreas of naive, Panin, and KPC mice (five mice per group). In C and D, mean and SD are shown. P values were calculated by ANOVA test with corrections for multiple comparisons. *, P < 0.05; **, P < 0.01; ***, P < 0.001; ****, P < 0.0001.

