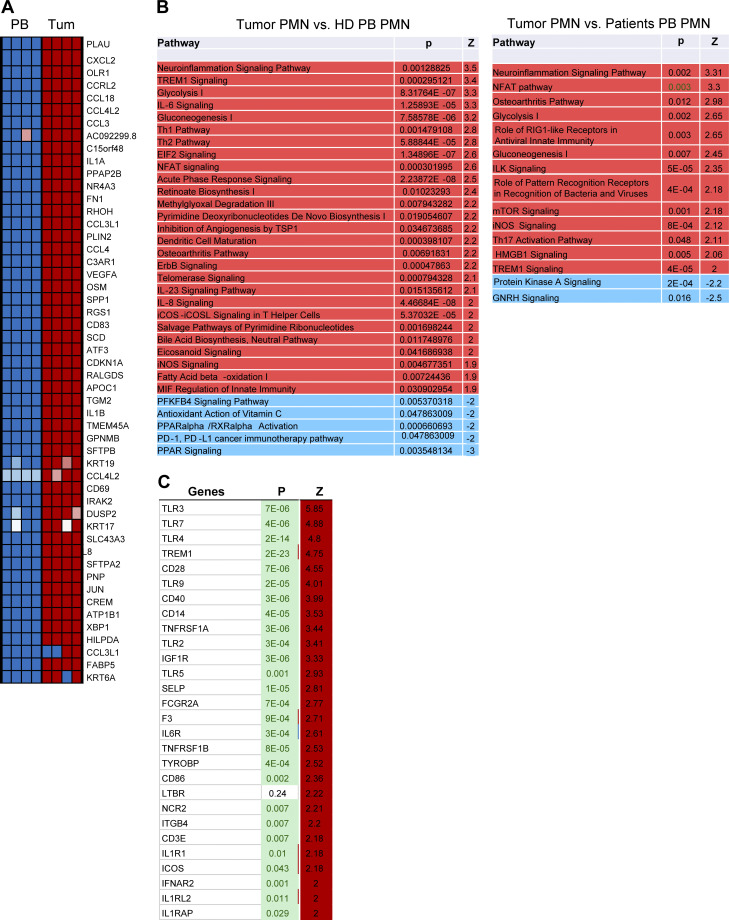
Figure S4.
Gene expression in cancer patient PMNs. (A) Top 50 changed genes in tumor PMNs compared with peripheral blood PMNs in the same patients. (B) IPA of tumor PMNs compared with peripheral blood (PB) healthy donor (HD) or patient PMNs. (C) Changes in the expression of genes encoding transmembrane receptors in tumor PMNs compared with peripheral blood PMNs from the same patient.

