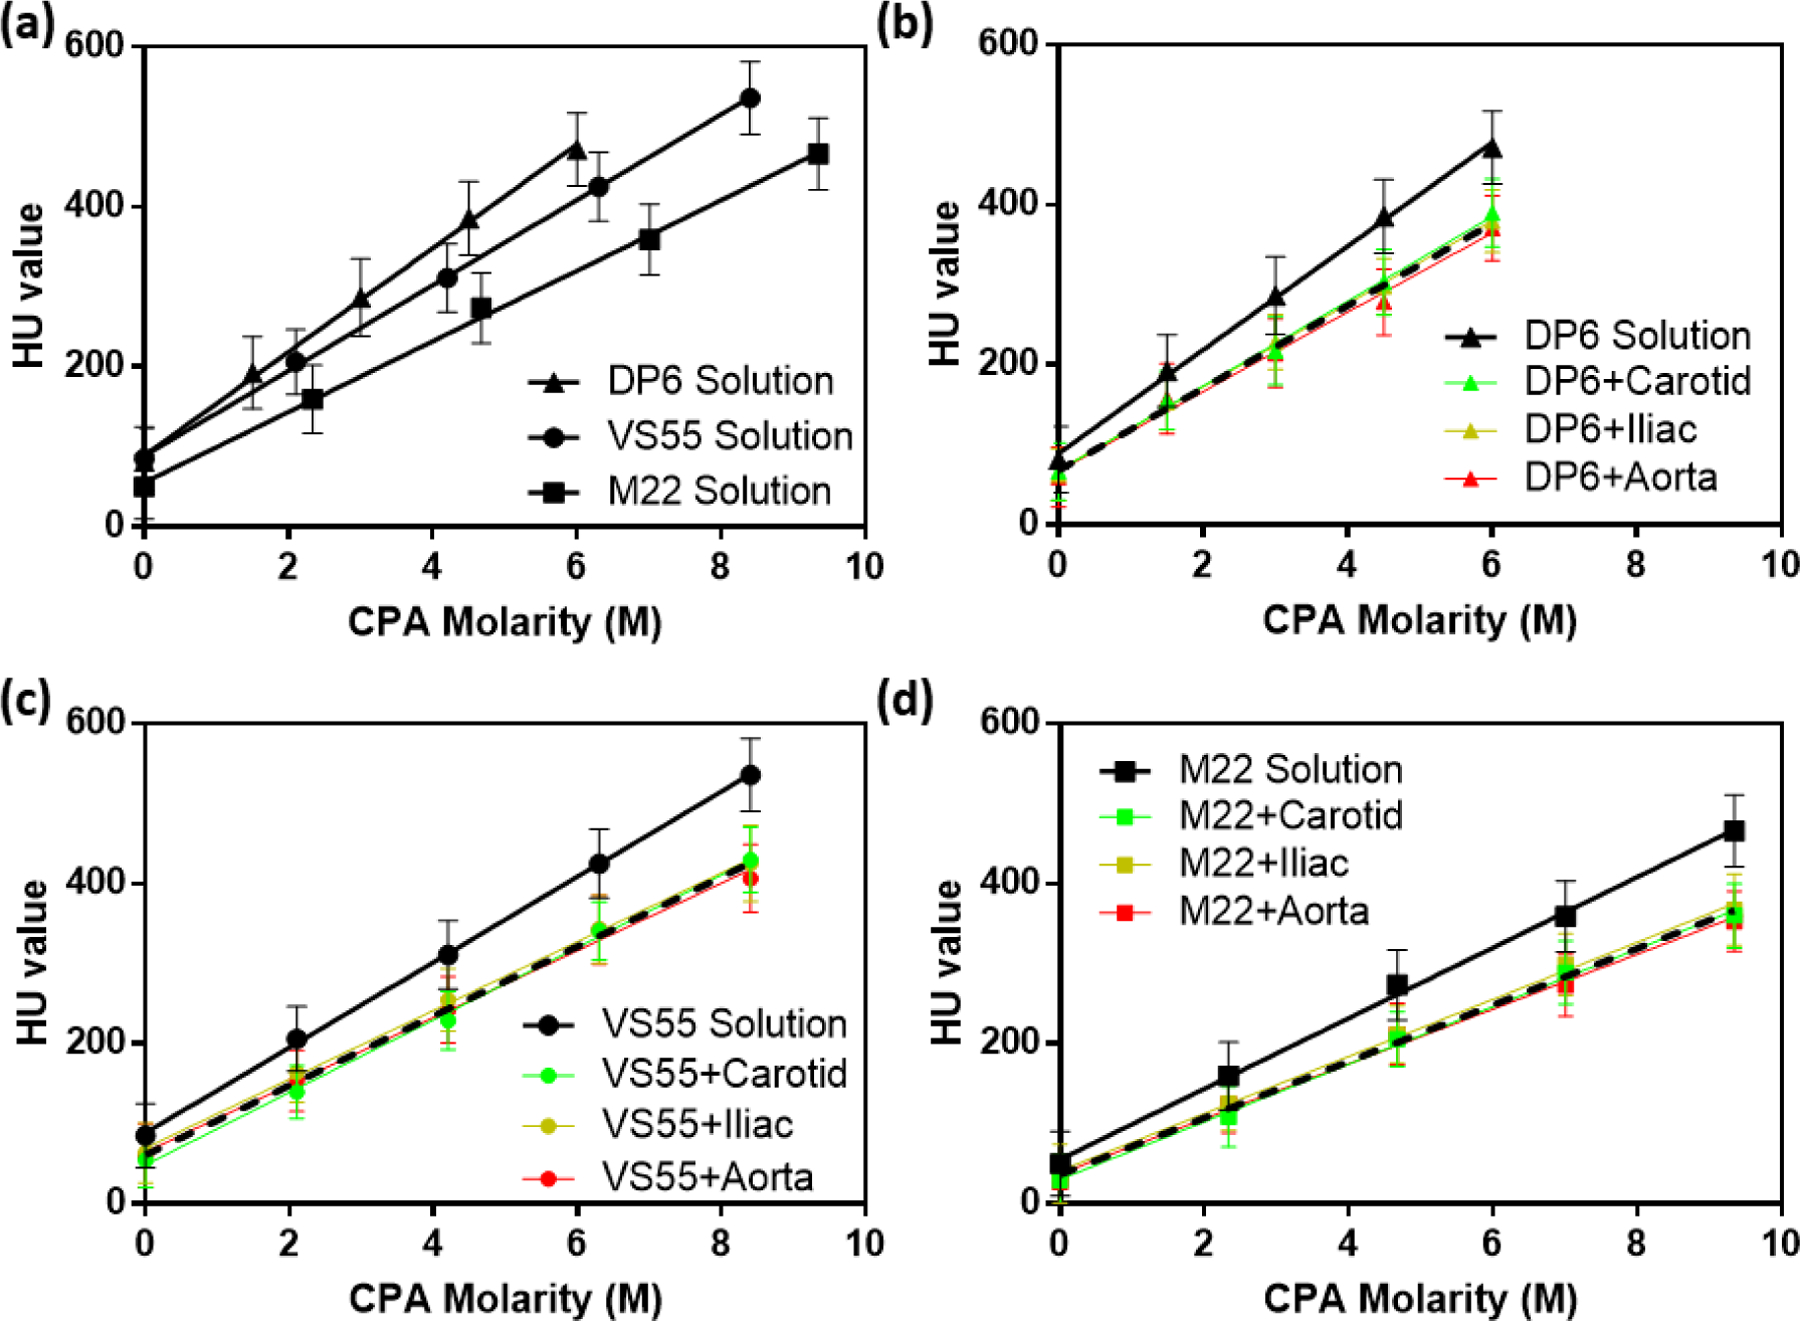
Figure 2.

HU obtained by μCT for diluted CPA solutions (0, 25, 50, 75, and 100%) and CPA-equilibrated arteries. (a) Three cocktail CPAs. (b) DP6 solution and DP6-diffused arteries. (c) VS55 solution and VS55-diffused arteries. (d) M22 solution and M22-diffused arteries. Black solid lines represent CPA solutions without arteries, green lines represent CPA-equilibrated carotid arteries, yellow lines represent CPA-equilibrated iliac arteries, and red lines represent CPA-equilibrated aortas. Black dash lines represent the pooled curves for all three types of arteries equilibrated with the same CPA.
