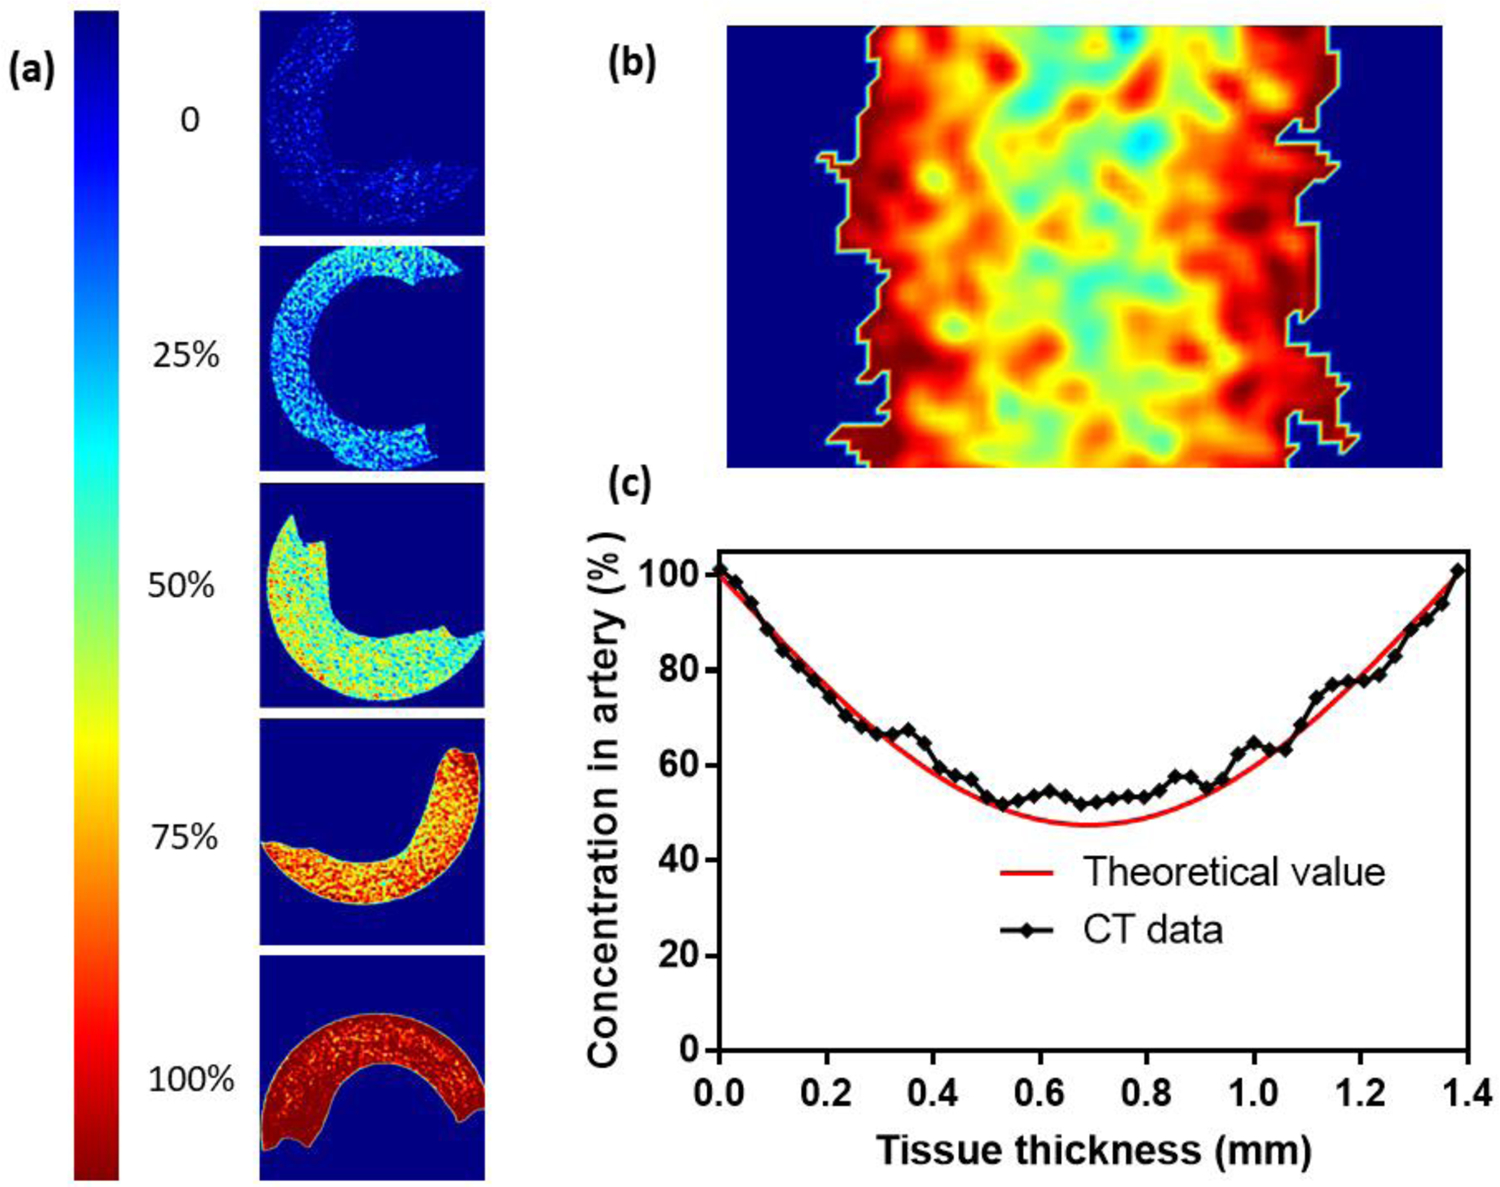
Figure 3.

Pseudocolor images for CPA equilibrated tissues and CPA concentration distribution after step loading. (a) Pseudocolor image for arteries diffused by diluted CPA (0 – 100%, 0 means carrier solution (Euro-Collins or LM5) only and 100% represents full strength CPA in carrier solution), here we present iliac arteries equilibrated with DP6 as an example. (b) Pseudocolor image for CPA distribution inside the arteries after 15 min step-wise loading. (c) Values for CPA distribution on cross section obtained by µCT compared to theoretical values. Here we present concentration curve of DP6 loaded iliac artery as an example (both b and c). The best fit diffusivity value for this sample is 6.5 ×10⁻¹¹ m2/s, R2 = 0.97.
