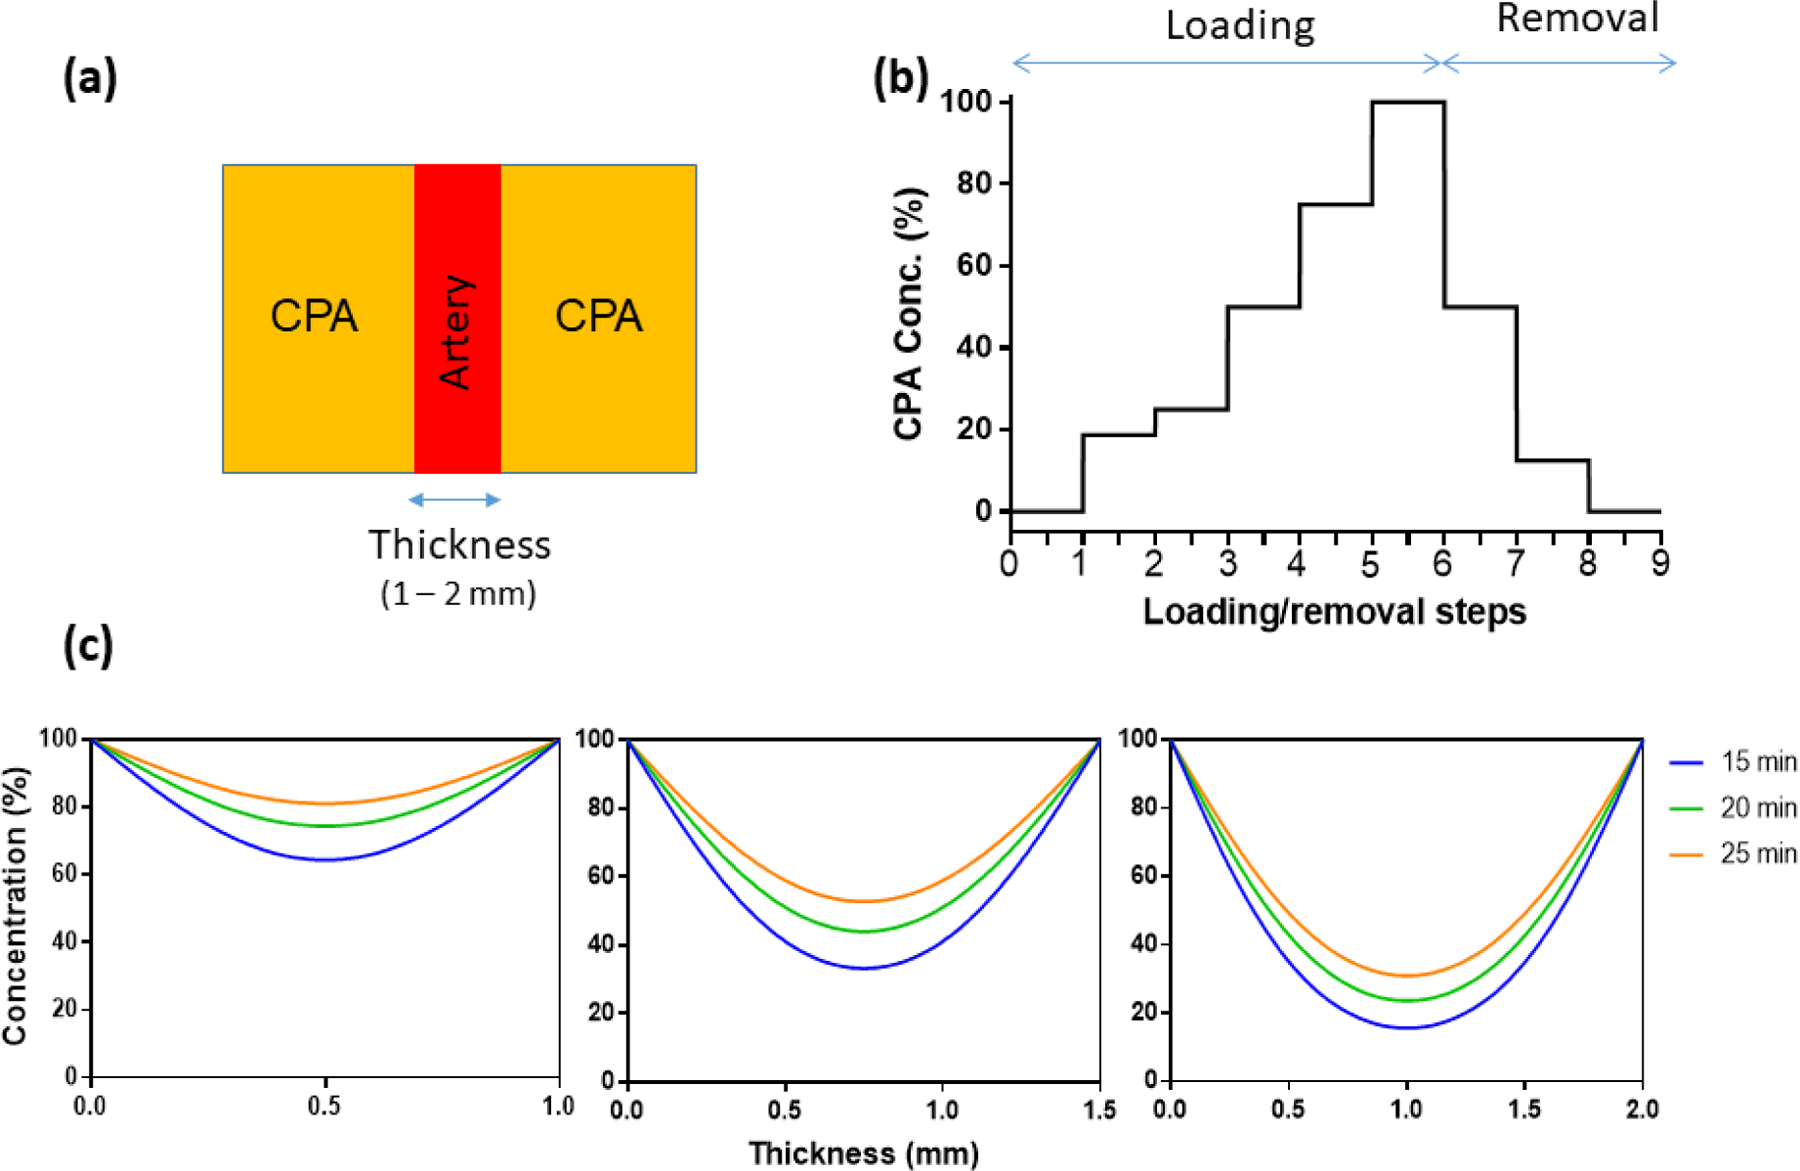
Figure 4.

CPA diffusion of arteries: diffusion geometry, diffusion boundary conditions, and diffusion results. (a) 1D geometry of arteries and surrounding CPA, cross-section view. (b) Concentration of CPA at every step during step-wise loading and removal. Concentrations are 0, 18.7, 25, 50, 75, 100% for loading, and 50, 12.5, and 0% for removal. (c) CPA distribution after step-wise loading (D = 6.5 ×10⁻¹¹ m2/s) with different time spans for carotid arteries (1mm), iliac arteries (1.5mm) and aortas (2mm).
