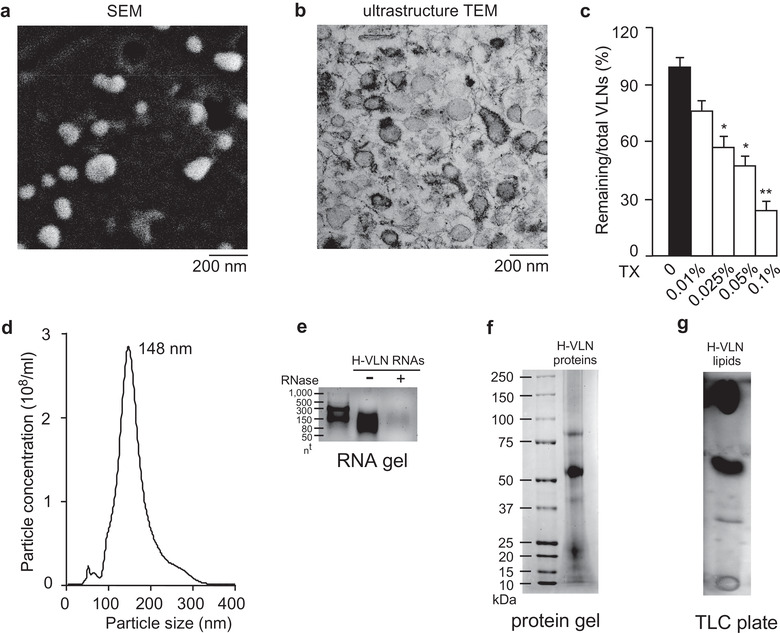
FIGURE 1.

Honey contained VLNs. [a. Representative SEM image of H‐VLNs. b. Representative ultrastructure TEM image of H‐VLNs. c. Triton X‐100 (TX) lysis of H‐VLNs. Different concentrations of TX were incubated with H‐VLNs followed by vigorous agitation. d. Size of H‐VLNs measured using a NanoSight NS300 instrument. e. RNA gel of H‐VLN RNAs. RNAs were incubated with (indicated by ‘+’) or without (indicated by ‘‐’) RNase (10 μg/ml) at 37°C for 30 min before they were loaded on a 2.5% agarose gel. nt: nucleotides. f. Protein gel of H‐VLN proteins. Proteins were run on a 4%–12% Bis‐Tris protein gel and visualized with Coomassie blue. g. TLC analysis of H‐VLN lipids. A TLC silica gel plate was used to run the lipids. Data were presented as mean ± SEM. N = 3. *P < 0.05, **P < 0.01 relative to H‐VLNs without detergent treatment (black bar)].
