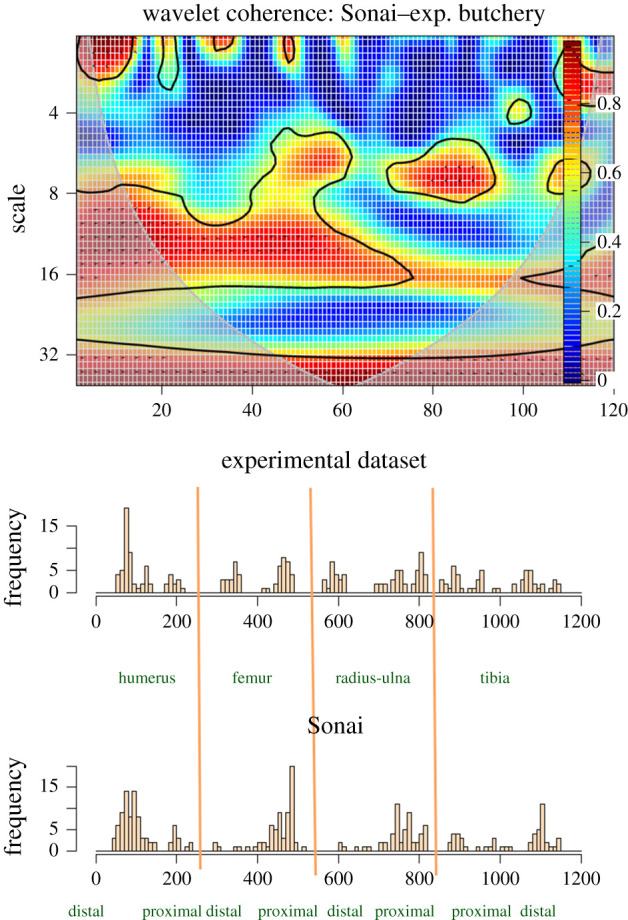
Figure 12.

Bivariate wavelet coherence plot showing the correlation of cut mark damage on the long series (humeri, femora, radii-ulnae and tibiae) of the Sonai ethnoarchaeological assemblage and the experimental dataset. Arrows indicate that in the four high-correlation areas, both series are in phase (i.e. they covary together in the same direction). The thick contour line designates the 5% significance level against red noise and the cone of influence.
