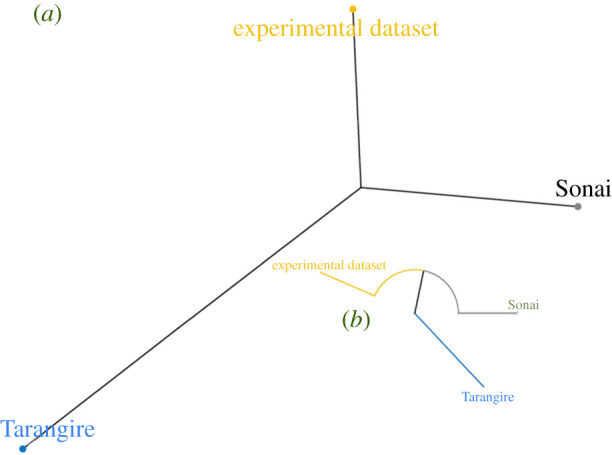
Figure 14.

Phylogenetic (a) and circular (b) dendrograms showing the distances of the wavelet spectra of the cutmarking patterns from the three series analysed: experimental butchery, Sonai ethnoarchaeological assemblage and the Tarangire lion carcasses.
