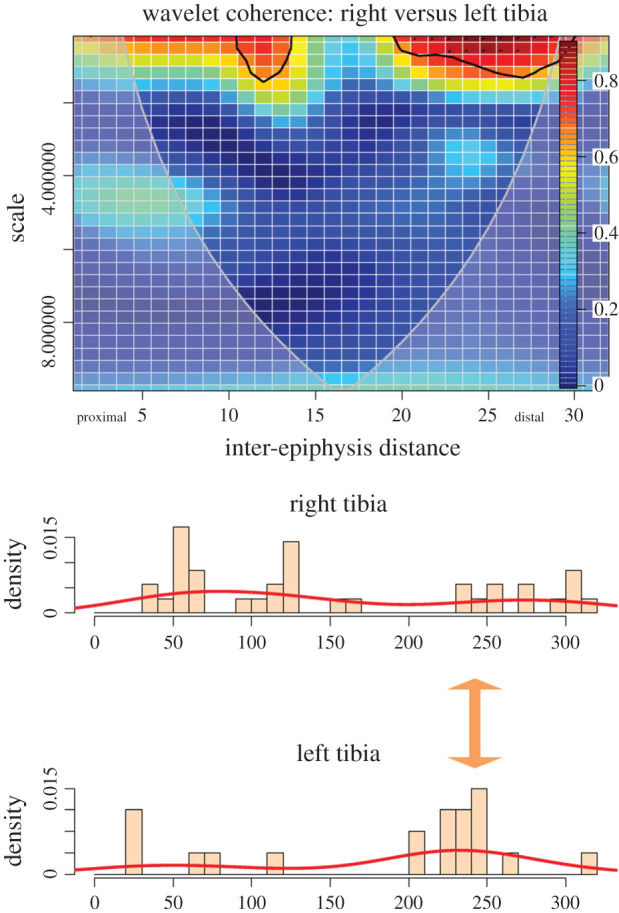
Figure 5.

Bivariate wavelet coherence plot showing the correlation of cut mark damage on the proximal, midshaft and distal sections of left and right tibiae of the experimental butchery dataset. Arrows indicate that in one high-correlation area, both series are in lag (i.e. they covary together in different directions). The thick black line designates the 5% significance level against red noise and the cone of influence. The thick arrow in between histograms indicates the locus of high correlation clustering between both series.
