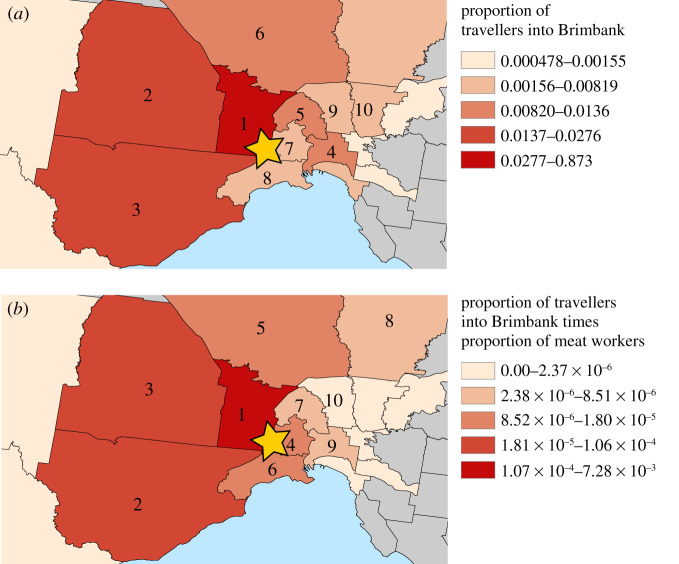
Figure 2.
Regional distribution of transmission risk from the Cedar Meats outbreak in Brimbank based on (a) mobility into Brimbank for daytime activities, and (b) the proportion of employed persons with occupations in meat processing multiplied by the proportion of travellers to Brimbank shown in (a). The yellow stars show the approximate location of the outbreak centre. The numbers in (a) and (b) show the rank of each region with respect to the mapped quantity. The colour scales were generated using the method of Jenks natural breaks.

