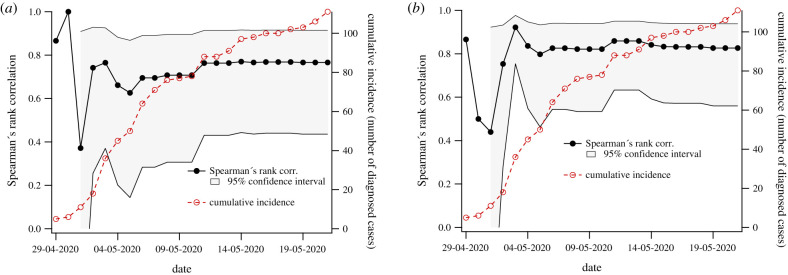
Figure 3.
Correlation between risk estimates and cumulative cases as a function of time. Spearman's correlation between cases by LGA and proportion of mobility into Brimbank is shown in (a), while (b) demonstrates the effect of including employment-specific contextual factors. Black dots correspond to Spearman's correlation (left y-axis), and the shaded interval is the 95% CI. For reference, open red circles show total cumulative cases over all regions recorded for each day (right y-axis).

