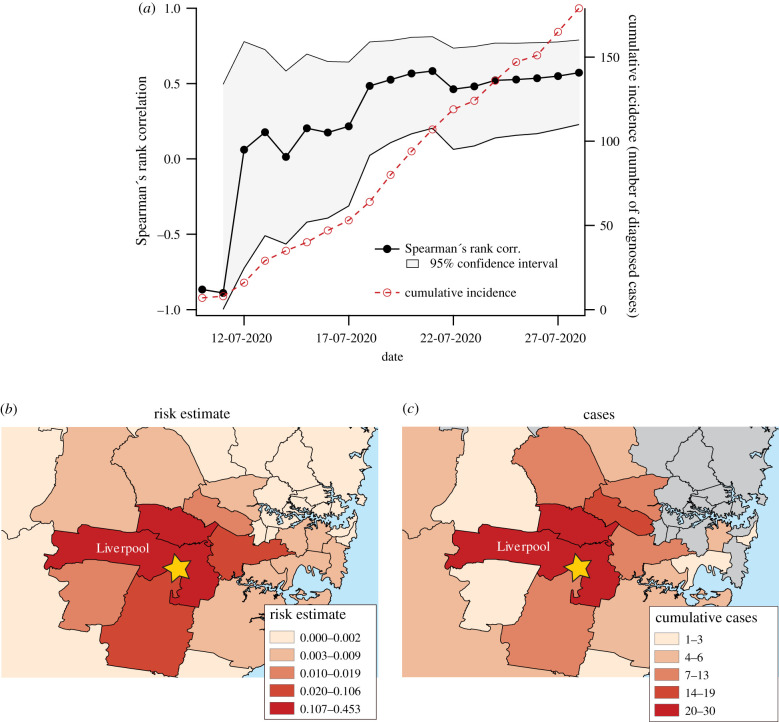
Figure 4.
Comparison between estimated relative risk distribution and cluster-related case numbers in New South Wales from 12 to 28 July. Spearman's rank correlation as a function of time is shown in (a). The spatial distribution of estimated relative risk computed based on mobility data recorded for the week ending on 4 July is shown in (b), while the total number of cluster-associated cases in each LGA as of 28 July is shown in (c). The yellow star in (b) and (c) indicates the location of the outbreak centre, the Crossroads Hotel located in Liverpool, NSW. Colour scales in (b) and (c) were generated using the method of Jenks natural breaks.

