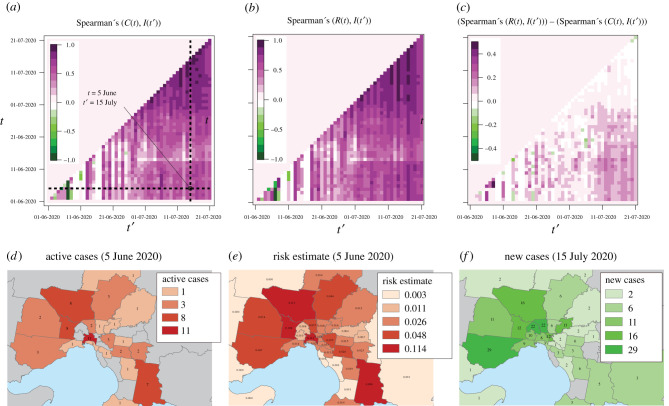
Figure 5.
The contribution of mobility information to relative risk estimates in a community transmission scenario. The correlation between active cases at time t and incident cases at time t′ is shown in (a) while the correlation of the mobility-based relative risk estimation at time t with incident cases at time t′ is shown in (b). The benefit of including mobility information is indicated in (c), which shows the values plotted in (b) minus those plotted in (a). The maps in (d–f) correspond to the (t, t′) point indicated in (a), and show the number of active cases on 6 June (d), the distribution of mobility-related relative risk on that day (e), and the number of incident cases on 15 July (f). The colour scales in (d–f) were generated using the method of Jenks natural breaks.

