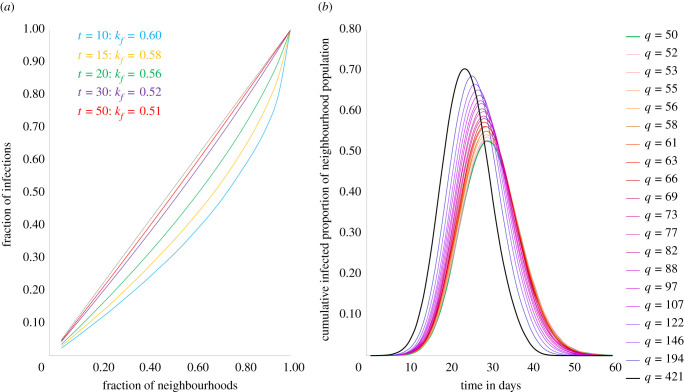
Figure 4.
Distribution and peak caseload simulation. (a) Simulation of distribution of cumulative caseloads across neighbourhoods over time. Distribution of cases is more unequal earlier in the epidemic and become less unequal as epidemic progresses (b) Simulation of current caseloads across neighbourhoods over time. Higher density neighbourhoods show earlier and sharper peaks in active cases compared to lower density neighbourhoods. Dashed black line: line of equality (y = x).

