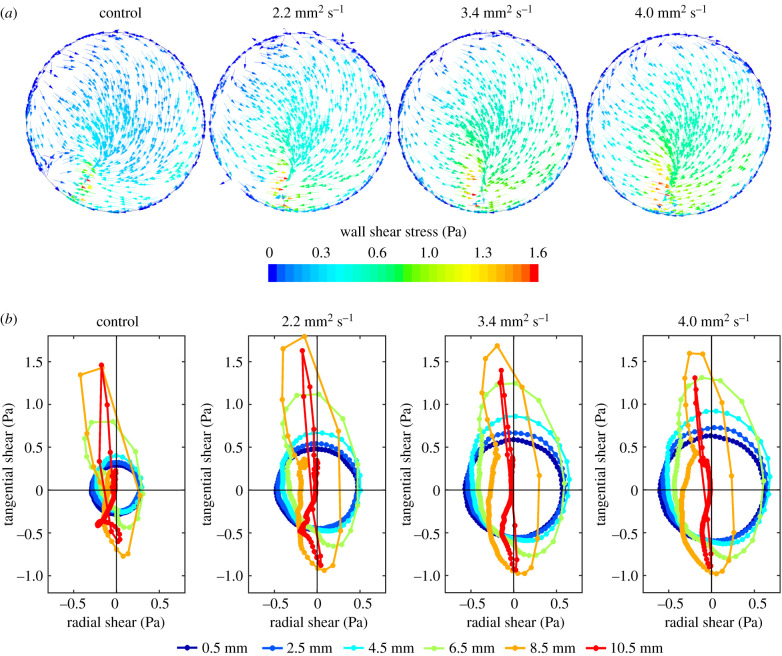
Figure 1.
(a) Pattern of shear stress on the base of a swirling well for all four viscosities at one time step, viewed from above. The direction of the arrows shows the direction of the shear stress, while the colour of the arrows shows its magnitude, as indicated by the colour bar. Like the wave, this pattern rotates clockwise with time but otherwise does not change, giving multidirectional shear of constant magnitude at the centre and uniaxial but pulsatile shear of fluctuating magnitude at the edge. (b) Polar plots showing the instantaneous WSS magnitude and direction over one cycle at points 0.5–10.5 mm from the centre of the well along a single radius. Panels from left to right show the control model (i.e. no dextran) and the models with increased viscosity. The plots show the location over time of the tip of the instantaneous WSS vector, which has its origin at 0.0. (Note that 0.0 does not designate the same real position for each differently coloured line, but the point along the radius for which the vectors were calculated.) The filled circles on each plot are spaced at equal time intervals of 5 ms. Negative radial values indicate vector components pointing to the left of the well and negative tangential values indicate components in the direction of the swirling wave when viewed from above.

